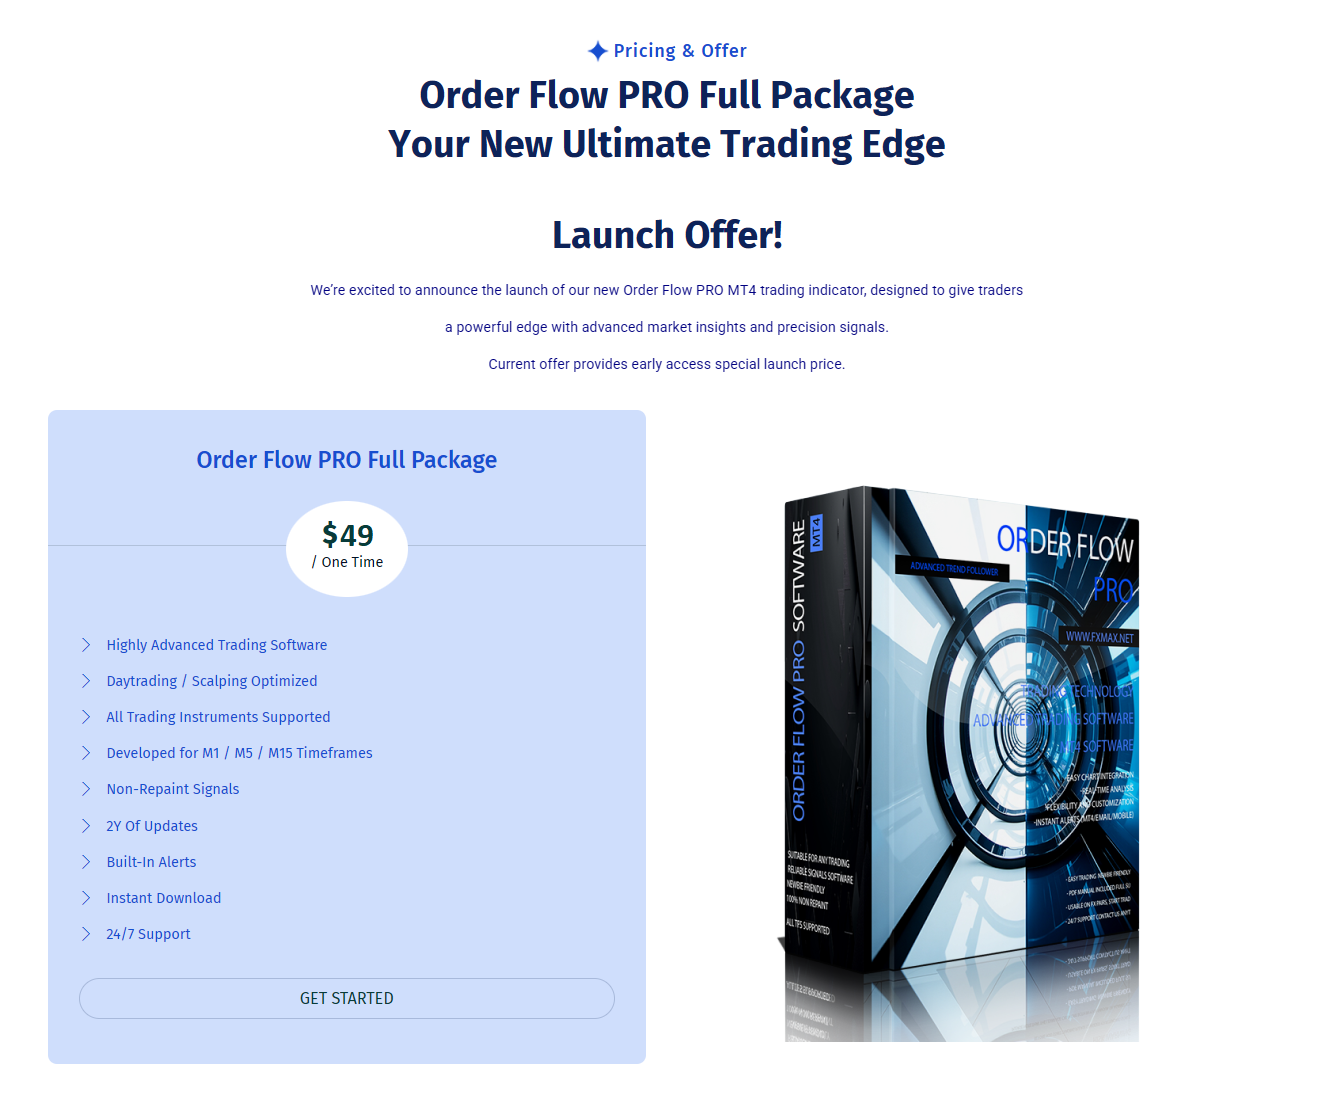
Flow Trader PRO – Advanced Price Action Visualization System for MT4
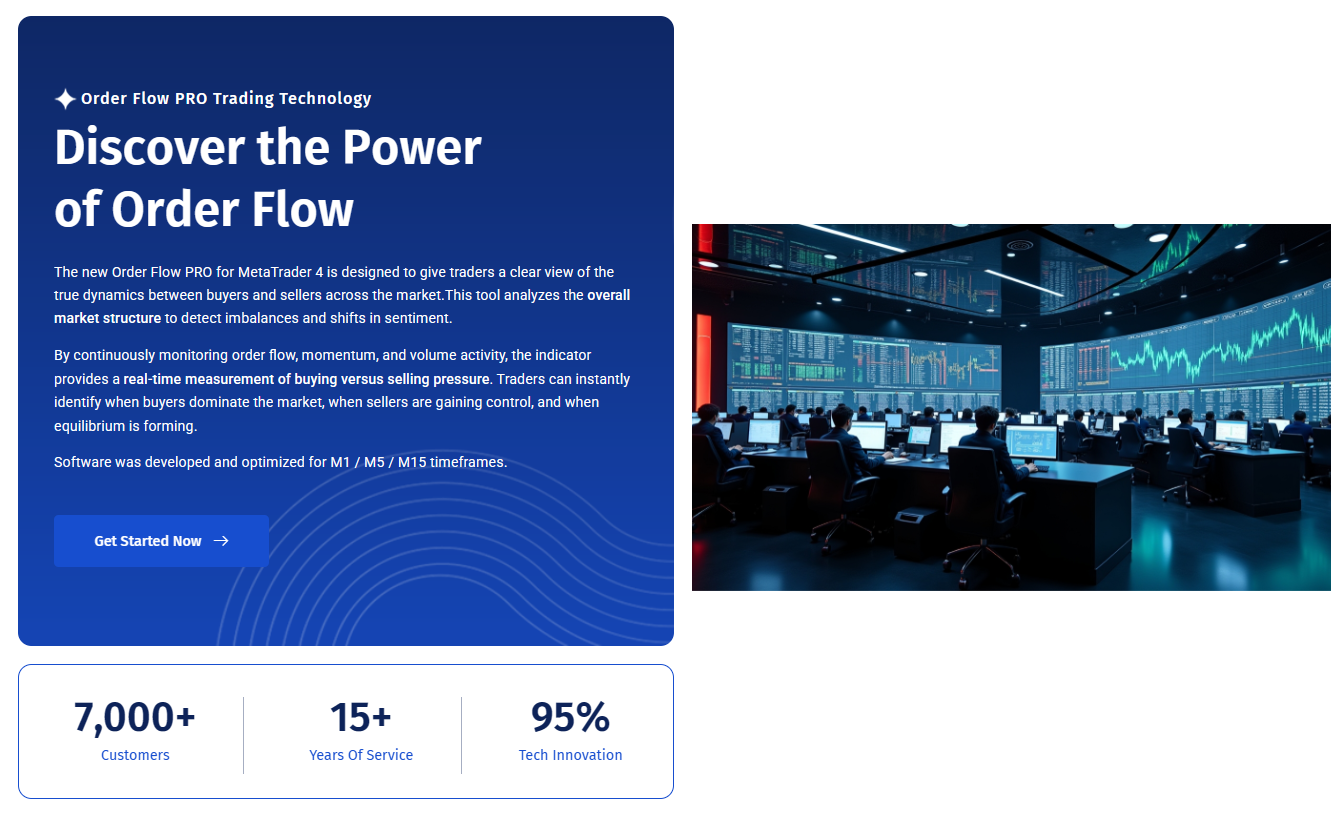
Flow Trader PRO is a professional-grade MetaTrader 4 indicator engineered for traders who rely on pure price action. It introduces a proprietary system of averaging candles that smooth out irregular price fluctuations, providing a clearer representation of market structure and directional bias.
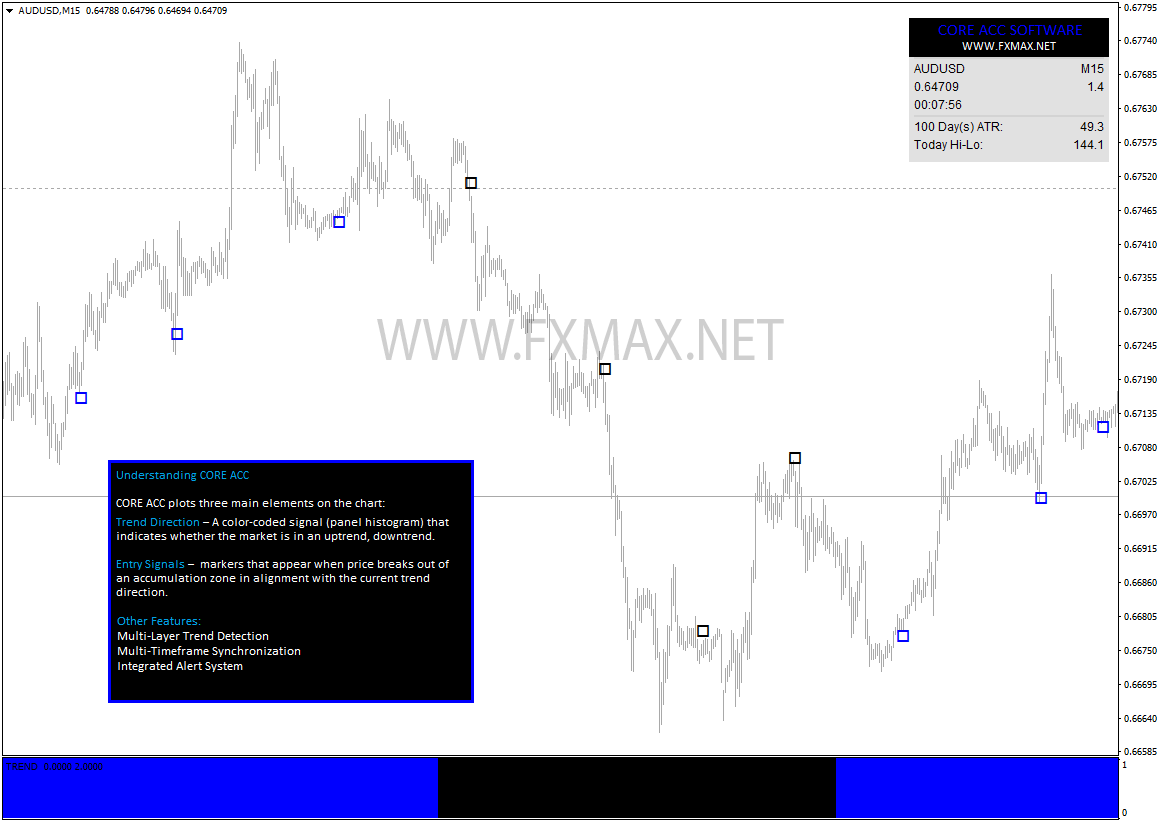
Core Concept
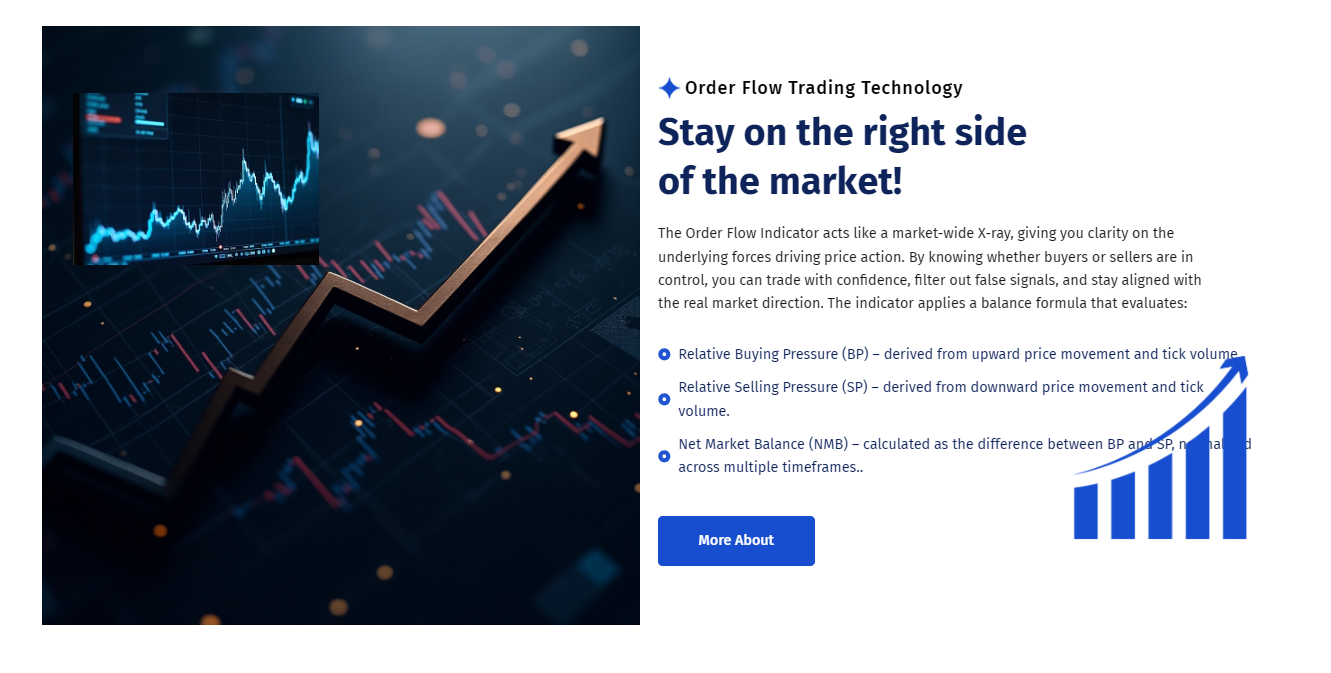
Flow Trader PRO’s Averaging Candle Algorithm (ACA) recalculates each bar using a dynamic weighting method that balances recent price data with adaptive volatility metrics.
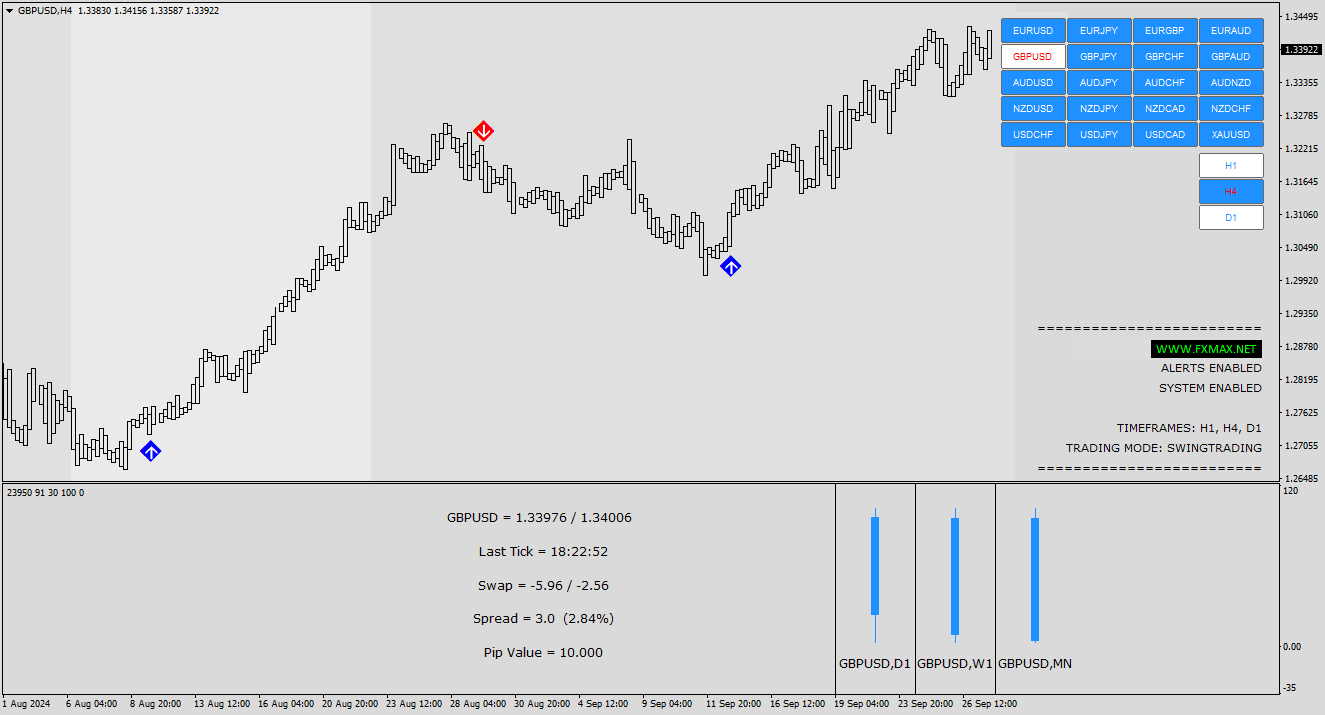
The result is a smoother, more stable visual representation that reflects true market flow without the lag typical of moving-average–based tools.Multi-Timeframe Confirmation (MTF System)
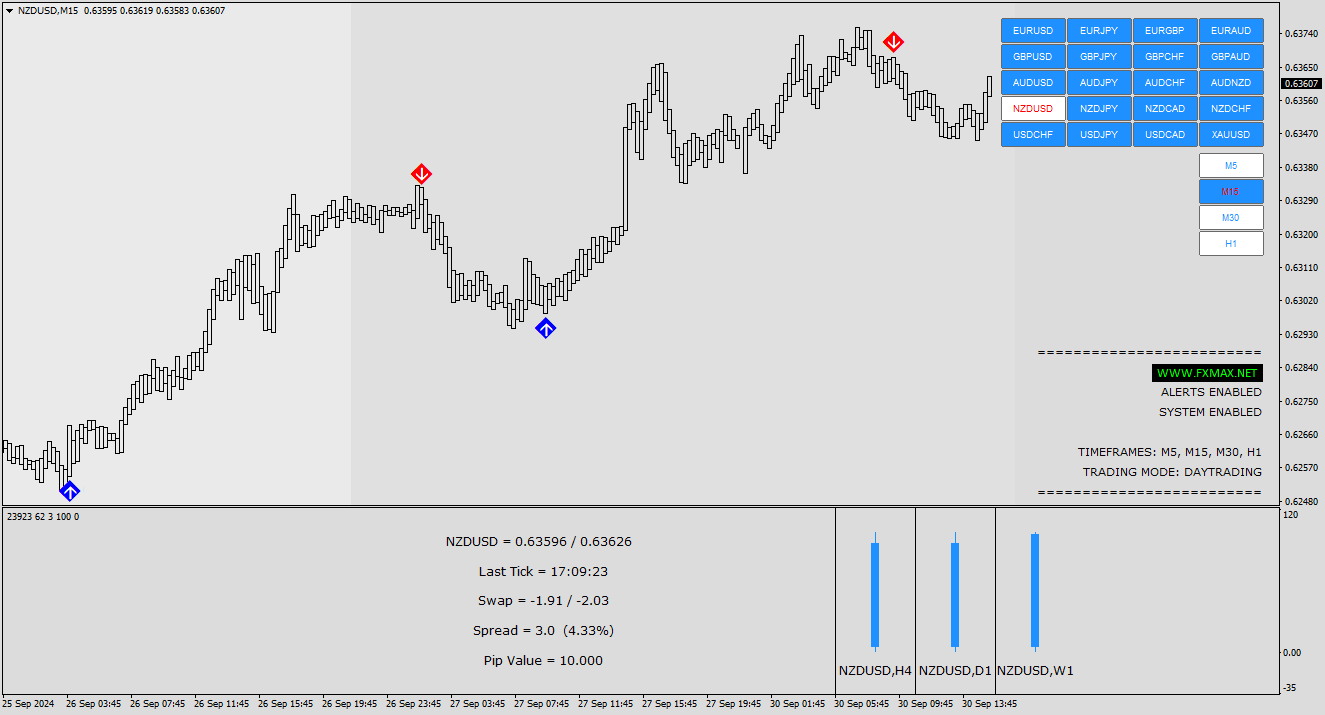
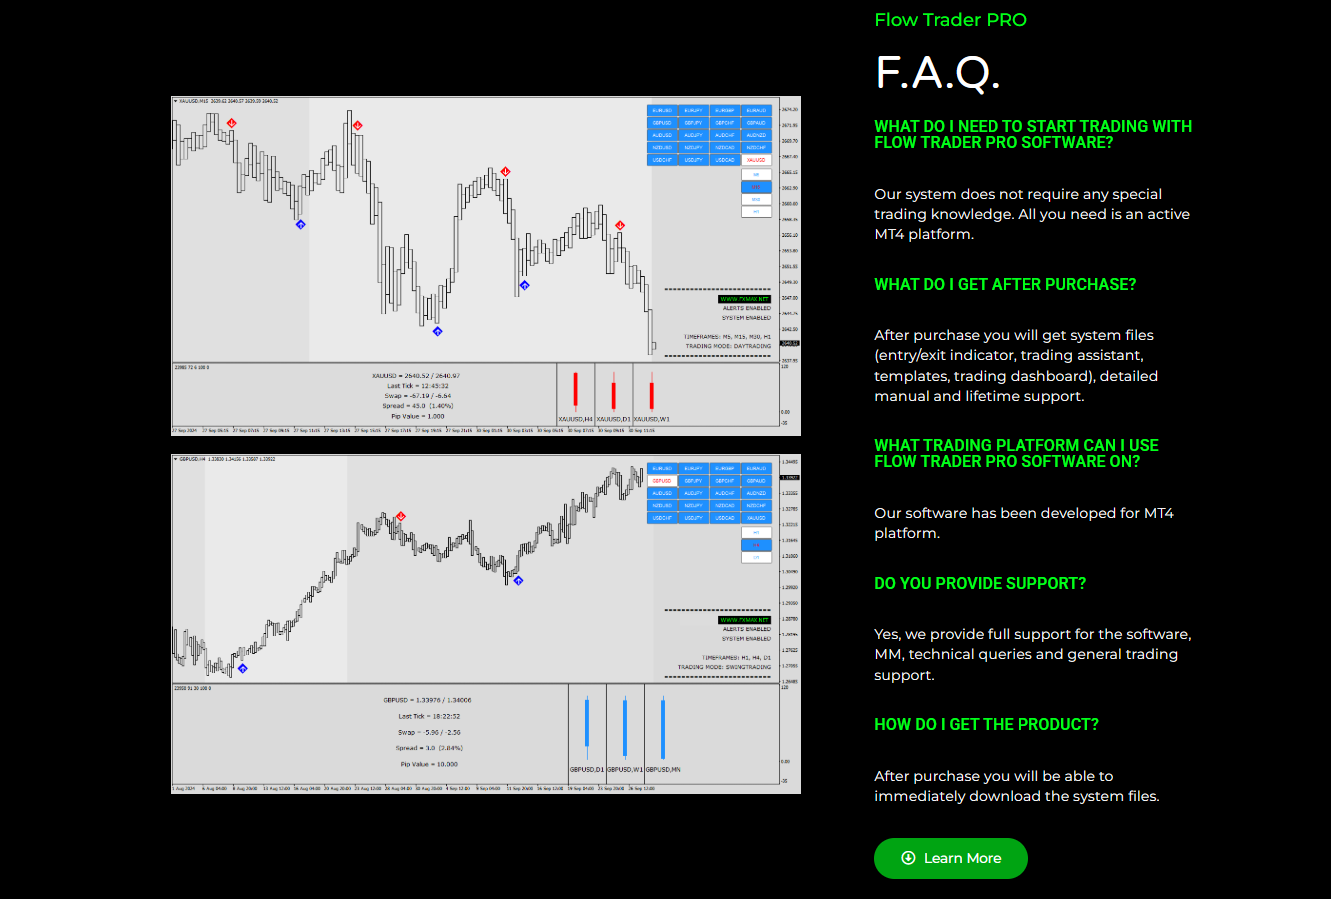
Flow Trader PRO integrates a multi-timeframe candle confirmation module, allowing traders to visualize higher-timeframe flow directly within their current chart.
This enables alignment between short-term setups and long-term directional context, improving trade timing and accuracy.Key Technical Features
Proprietary Averaging Candle Engine (ACA) for enhanced market clarity
Real-time Multi-Timeframe (MTF) Confirmation System
Noise-reduction logic based purely on price movement
Lightweight code optimized for MT4 performance
Compatible with any timeframe and trading style
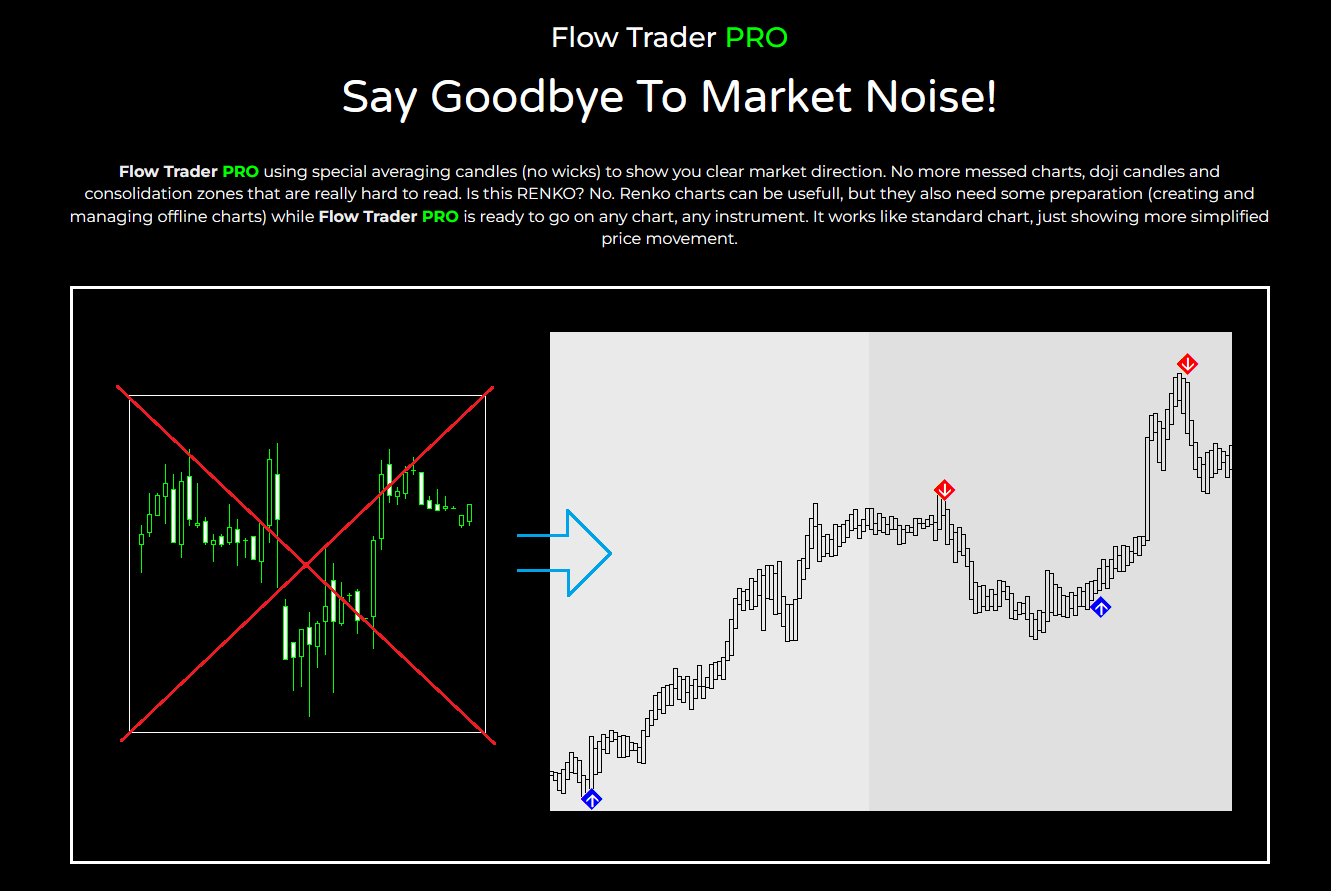
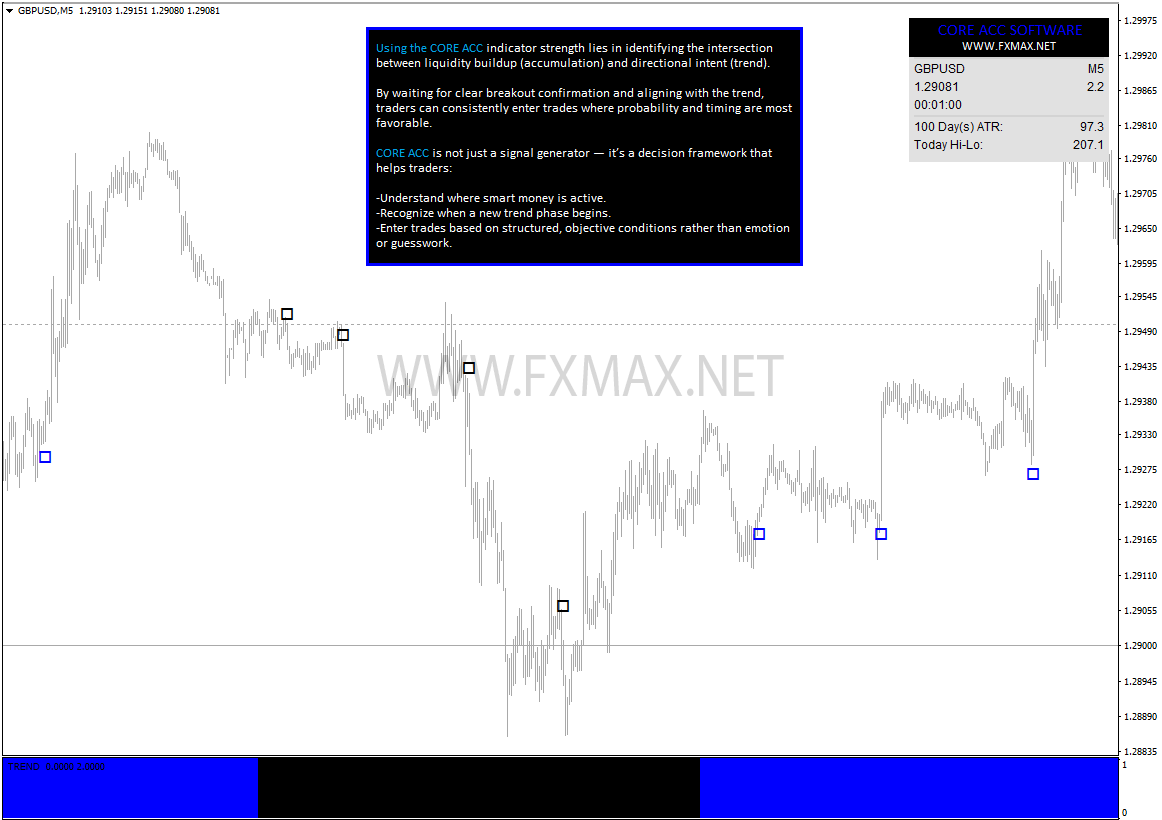
Simplified Price Action
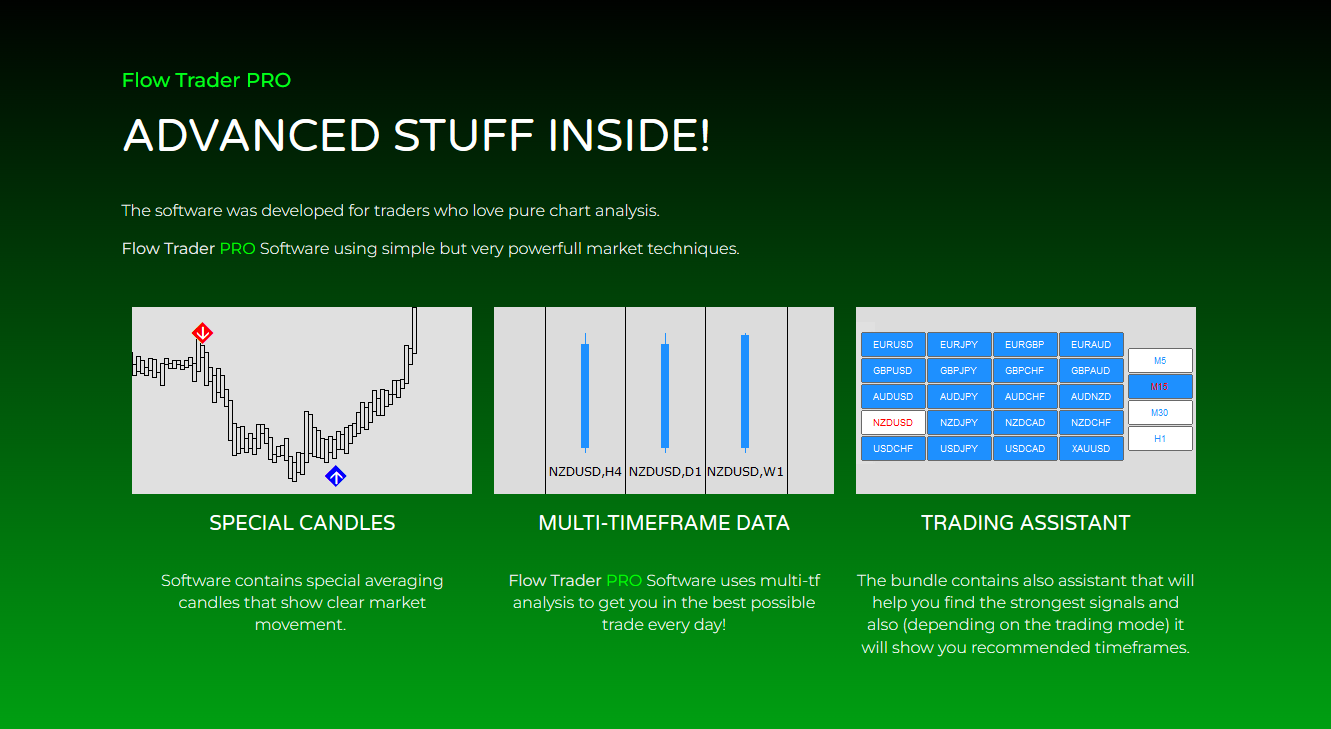
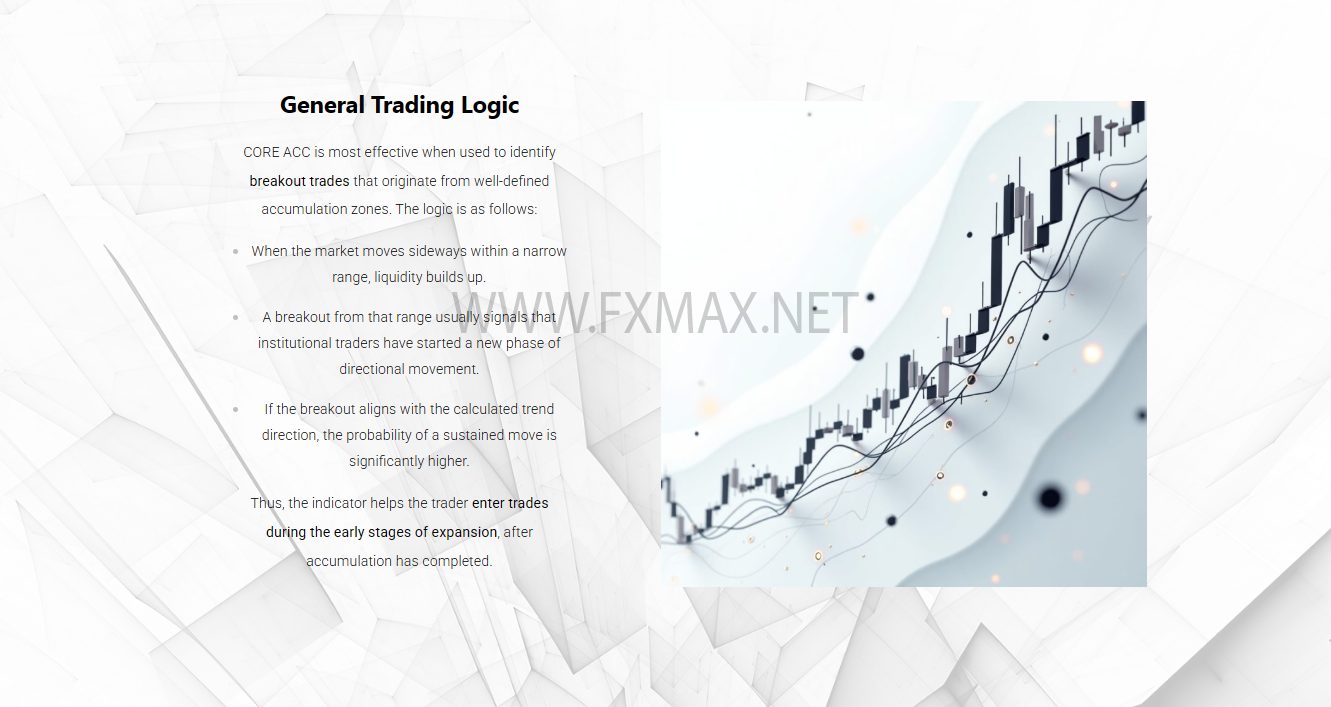
Traditional candlestick charts can often appear chaotic, especially in volatile or ranging markets. Flow Trader Pro solves this by introducing special averaging candles that smooth out minor fluctuations and emphasize meaningful price movement.
These candles:
- Filter out market noise
- Highlight real trends and momentum
- Make structure and direction easier to interpret
- Help traders stay in trades longer without being shaken out by small pullbacks
The result is a cleaner chart that allows traders to read price action more confidently and with less emotional interference.
Key Features of Flow Trader Pro
- Advanced Price Action Analysis
The indicator focuses purely on price behavior—no lagging oscillators or unnecessary complexity—giving traders a more natural and direct understanding of the market. - Special Averaging Candles
Unique smoothed candles provide a simplified representation of price, making trends, pullbacks, and reversals easier to identify at a glance. - Multi-Timeframe (MTF) Confirmation
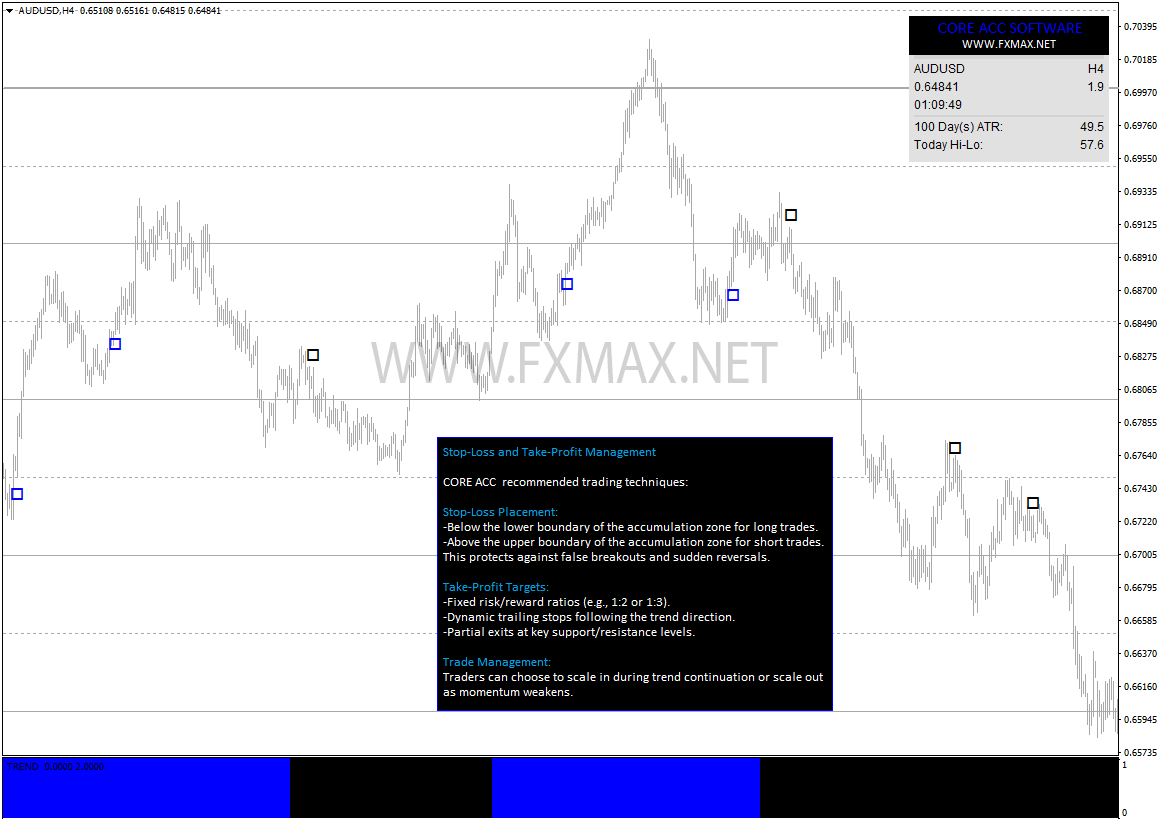
Flow Trader Pro integrates higher timeframe data directly into the chart, allowing traders to align entries with the broader market direction and avoid counter-trend trades. - Trend Identification & Continuation Signals
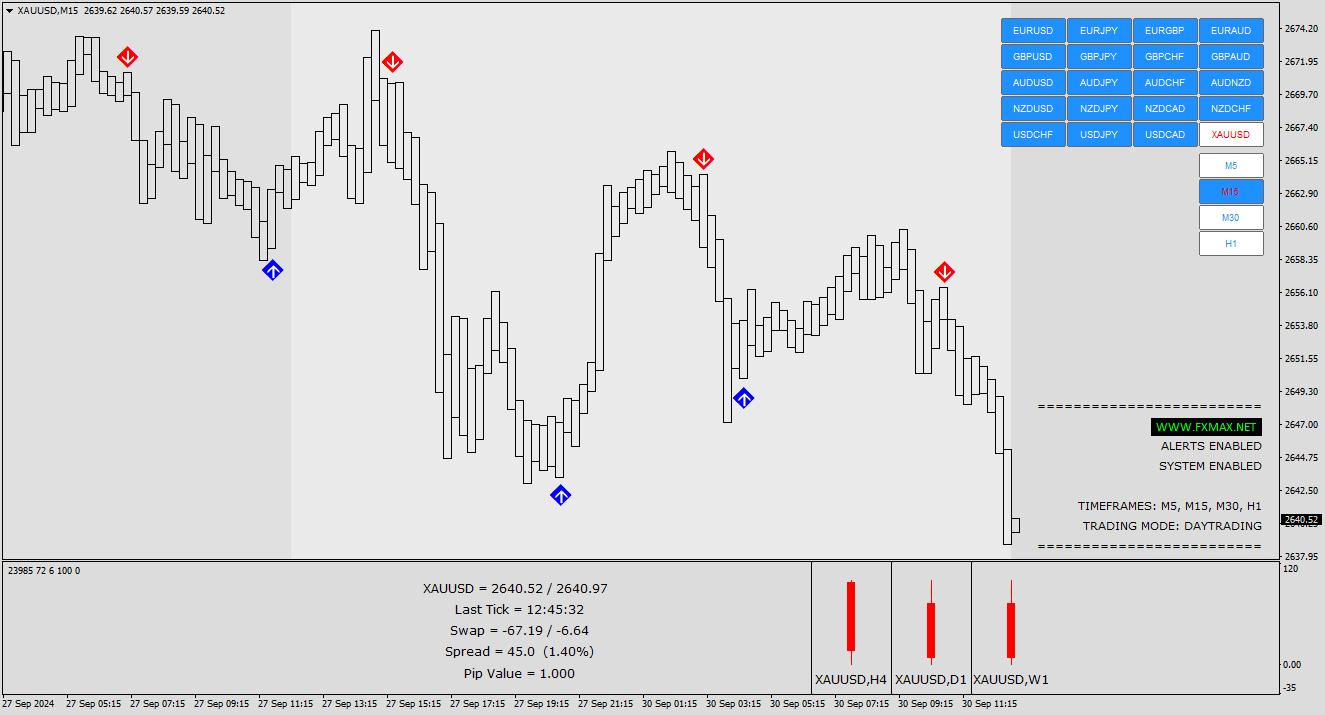
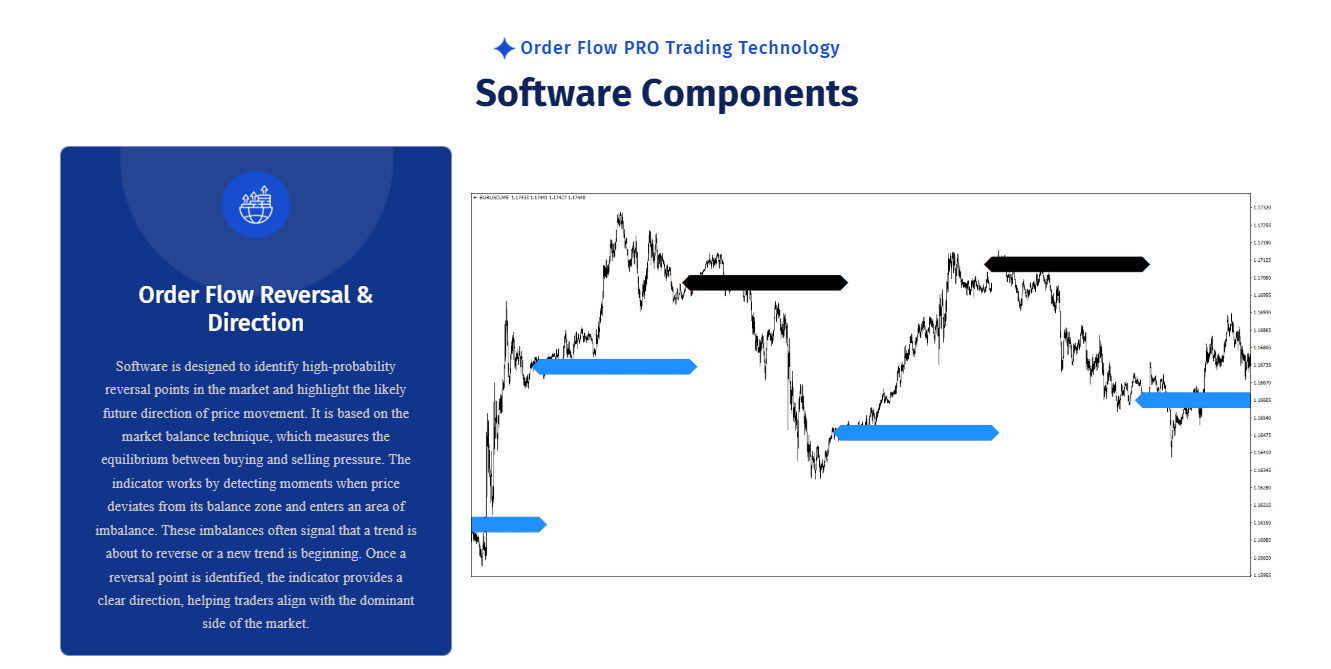
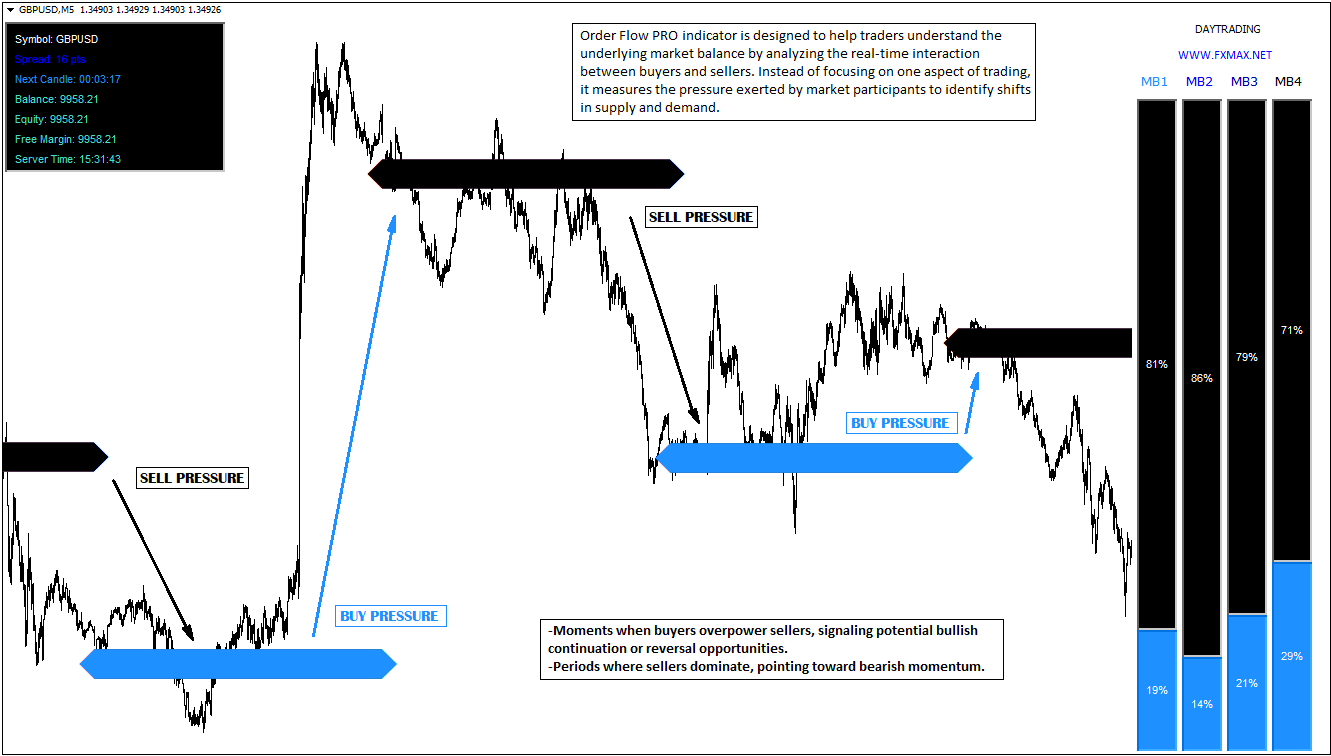
By combining smoothed candles with structural analysis, the indicator helps traders recognize strong trends and identify high-probability continuation setups. - Early Reversal Indications
Changes in candle structure and momentum can signal potential reversals before they become obvious on standard charts. - Noise Reduction for Better Decision-Making
The smoothing algorithm eliminates minor fluctuations, helping traders avoid overtrading and focus only on high-quality setups. - Adaptable to All Trading Styles
Whether you are scalping, day trading, or swing trading, Flow Trader Pro adjusts seamlessly across different timeframes and market conditions.
Order Flow Pro – Advanced MT4 Indicator for Buyer vs Seller Pressure Analysis
Order Flow Pro is a sophisticated MT4 indicator developed for traders who want to go beyond traditional technical analysis and gain insight into the true forces moving the market. By focusing on order flow and market participation, the indicator reveals the real-time interaction between buyers and sellers, helping traders make more informed and confident decisions.
Unlike standard indicators that rely solely on historical price data, Order Flow Pro is designed to interpret the underlying pressure behind price movements. It evaluates how aggressively market participants are entering positions—whether buyers are lifting offers or sellers are hitting bids—and translates this activity into a clear and actionable visual format.
Understanding Market Pressure
At any moment in the market, price moves as a result of imbalance between supply and demand. Order Flow Pro captures this imbalance by analyzing the relative strength of buying and selling activity. When buying pressure dominates, it suggests that market participants are willing to transact at higher prices, often leading to bullish momentum. Conversely, strong selling pressure indicates bearish control and potential downward movement.
This insight allows traders to:
- Identify who is in control of the market
- Avoid entering trades against dominant pressure
- Anticipate potential continuation or exhaustion of trends
Key Features of Order Flow Pro
- Real-Time Buyer vs Seller Pressure Analysis
The indicator continuously monitors and displays the balance between buyers and sellers, allowing traders to see shifts in control as they happen. - Dynamic Visualization of Order Flow
Order Flow Pro presents complex data in a simplified visual format, making it easy to interpret even during fast market conditions. Clear signals and pressure readings are displayed directly on the chart. - Momentum and Trend Confirmation
By aligning trades with strong buying or selling pressure, traders can confirm the validity of trends and avoid false breakouts or weak setups. - Early Detection of Market Reversals
When price continues in one direction but underlying pressure weakens or shifts, Order Flow Pro can highlight these divergences, providing early warnings of possible reversals. - Improved Trade Timing
Understanding when pressure is increasing or fading helps traders refine their entries and exits, leading to more precise trade execution. - Multi-Timeframe Compatibility
The indicator works effectively across various timeframes, making it suitable for scalping, intraday trading, and swing trading strategies.
Why Use Order Flow Pro?
Markets are driven by decisions made by traders and institutions. Order Flow Pro helps you see those decisions in action by focusing on the actual flow of orders rather than just the result (price). This gives you a significant advantage in understanding market sentiment and positioning yourself accordingly.
Instead of reacting late to price movements, you gain the ability to:
- Trade in the direction of real market strength
- Filter out low-quality signals
- Increase confidence in your trading strategy
- Manage trades with better awareness of changing conditions
CORE ACC Indicator – Technical Overview
CORE ACC is an MT4 custom indicator that provides trade entry signals based on accumulation zone detection and trend calculation. The indicator is designed to help traders identify potential market turning points and continuation phases by analyzing price behavior and volume distribution over time.
1. Purpose
The CORE ACC indicator combines accumulation analysis and trend structure detection to identify optimal entry points in alignment with the dominant market direction. It assists traders in recognizing zones where institutional participants are likely accumulating or distributing positions before a directional move.
2. Core Logic
The indicator operates based on two main analytical components:
a. Accumulation Zones
The algorithm detects periods of low volatility and horizontal price movement that indicate accumulation or distribution phases.
These zones are calculated using price range compression, candle structure, and relative volume activity.
Once the price breaks out of an accumulation zone with momentum, a potential entry signal is generated.
b. Trend Calculation
CORE ACC includes an internal trend engine that calculates the current directional bias of the market.
The trend is determined using smoothed moving averages, directional momentum, and price structure validation.
Trend confirmation ensures that signals are aligned with higher probability market direction, reducing false entries.
3. Signal Generation
An entry signal is triggered when both conditions are met:
Price exits an accumulation zone with valid breakout criteria.
The calculated trend direction confirms the breakout direction.
Buy signals occur when an accumulation breakout aligns with an uptrend.
Sell signals occur when an accumulation breakout aligns with a downtrend.
Each signal is displayed directly on the chart using visual markers.
4. Chart Display
CORE ACC plots the following elements on the chart:
Trend Direction: Color-coded histogramr panel showing the current market bias (bullish or bearish).
Entry Signals: Upward or downward markers indicating confirmed entry opportunities.
All visual components update in real-time with each new tick, ensuring accurate and up-to-date information.
5. Recommended Usage
Timeframes: Works on all MT4 timeframes (M1–D1).
Markets: Compatible with Forex, indices, metals, and cryptocurrencies.
VIDEO TUTORIAL
MT4 Advanced Fibonacci Indicator with MTF Dashboard
MT4 Advanced Fibonacci Indicator with a Multi-Timeframe (MTF) Dashboard that automatically plots Fibonacci levels and provides alerts.
Overview
The MT4 Advanced Fibonacci Indicator (MTF Dashboard) is a professional MetaTrader 4 indicator that automatically identifies swing highs/lows, draws Fibonacci retracement and extension levels across multiple timeframes, and displays a compact dashboard summarizing the status per timeframe and symbol. The indicator supports configurable alerts (popup, sound, email, push) when price approaches important levels, when new swings form, or when a level is broken — giving you timely, actionable notifications without constantly watching the screen.
Key Features
Automatic Fibonacci plotting: Detects swing high/low points and draws retracement and extension levels automatically.
Multi-Timeframe (MTF) Dashboard: Shows the Fibonacci structure and level proximity for several user-selected timeframes (e.g., M15, H1, H4, D1) in one compact panel.
Alerts: Popup, sound, email and push notifications for events such as: price touching a Fibonacci level, multiple timeframe confluence, level breakouts, and new swing creation.
Customizable levels: Choose which Fibonacci levels to display (e.g., 23.6, 38.2, 50.0, 61.8, 78.6, 100, 161.8, 261.8).
Level proximity filter: Trigger alerts only if price is within a configurable number of pips or percentage of a level.
Confluence & signal scoring: Score or highlight levels that align across timeframes or with other filters (MA trend, pivot, RSI support/resistance).
Non-repainting swing detection: Uses confirmed swing logic (e.g., number of bars after pivot) to avoid false repainting where possible.
Persistent object naming: Each Fibonacci drawing has a consistent name so you can programmatically reference or remove it.
Visual customization: Colors, line widths, label formats, box transparency, and dashboard position are all configurable.
Performance optimized: Draws only necessary objects and minimizes CPU usage to be MT4-friendly.
Symbol & timeframe scanning: Dashboard can be configured to monitor the current symbol or multiple symbols via a symbol list.
How it Works (brief)
Swing detection: The indicator scans recent price action and identifies swing highs and lows using a configurable ‘lookback’ (pivot bars left/right) to ensure reliable pivots.
Fibonacci drawing: For each confirmed swing, it automatically draws retracement and extension levels from the swing low to swing high (or vice versa).
MTF aggregation: The dashboard requests Fibonacci data from higher/lower timeframes and displays a consolidated view — showing the nearest level, distance to price, and confluence across timeframes.
Alerts engine: Continuously monitors price vs levels and triggers alerts based on user rules (distance threshold, confluence count, breakout detection).
The Dashboard Scans Every Time Frame On Your Chart
The Fibonacci Dashboard is equipped with specific charting images on each time frame all the way from the minute chart all the way up to a daily chart. This is fully customizable and give you, the trader, the ability to pull whatever market and whatever time frame you wish to trade.


X-Breaker PRO - Heatmap Analysis