
The Ultimate MT4 Indicator for Rapid Entries and Precision Trading
Supreme Trading PRO is a next-generation indicator designed for traders who demand speed, accuracy, and consistency in the markets. Built for MetaTrader 4, it combines cutting-edge algorithms with Multi-Timeframe (MTF) analysis to deliver high-probability trading signals across all instruments – forex, indices, commodities, stocks, and cryptocurrencies.
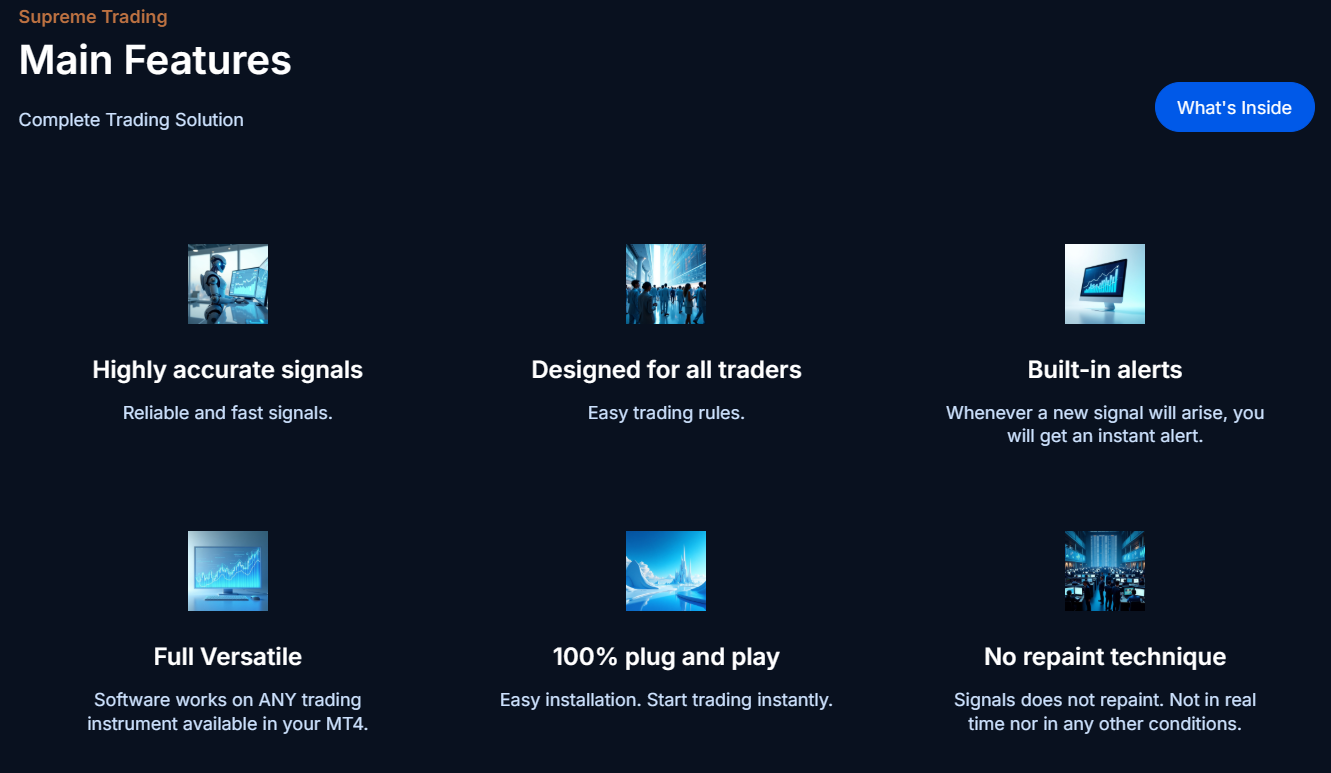
Key Features:
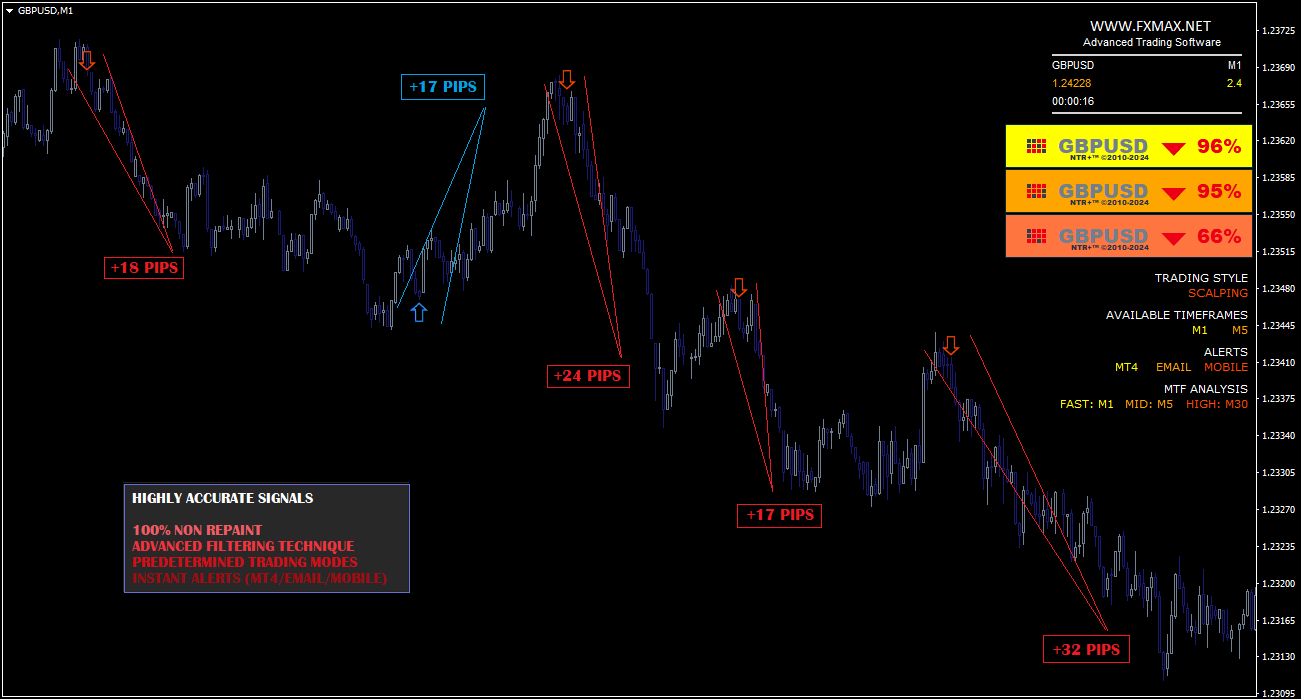
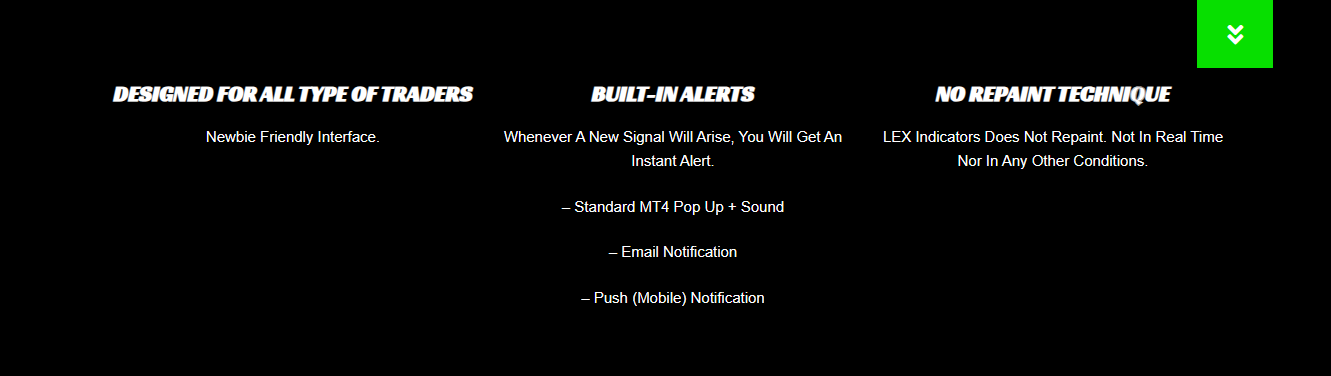
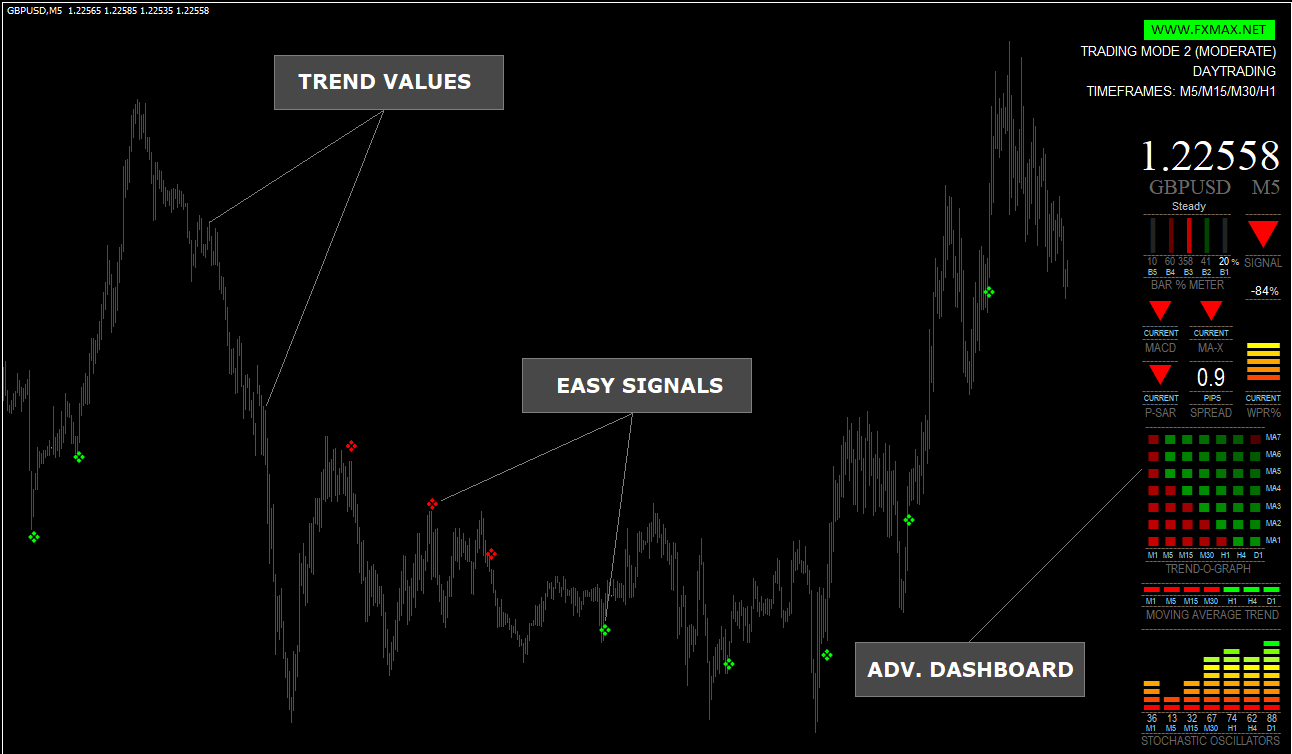
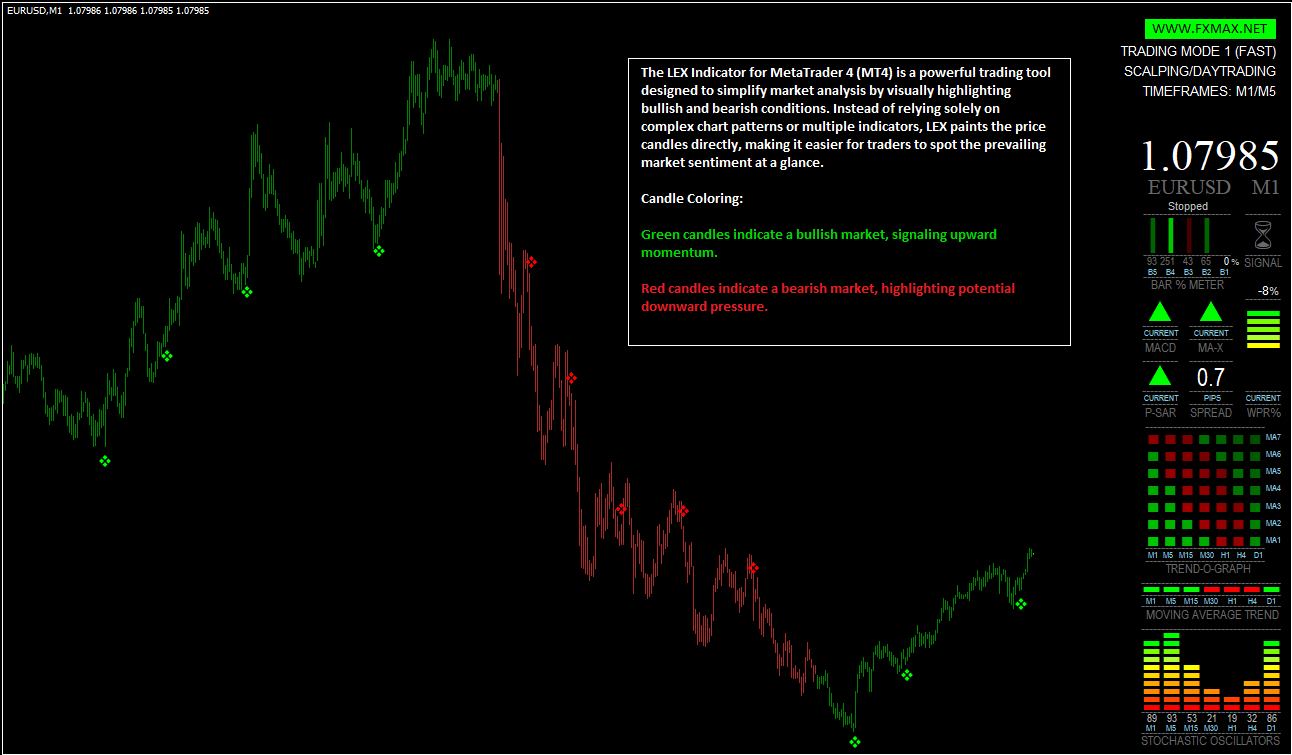
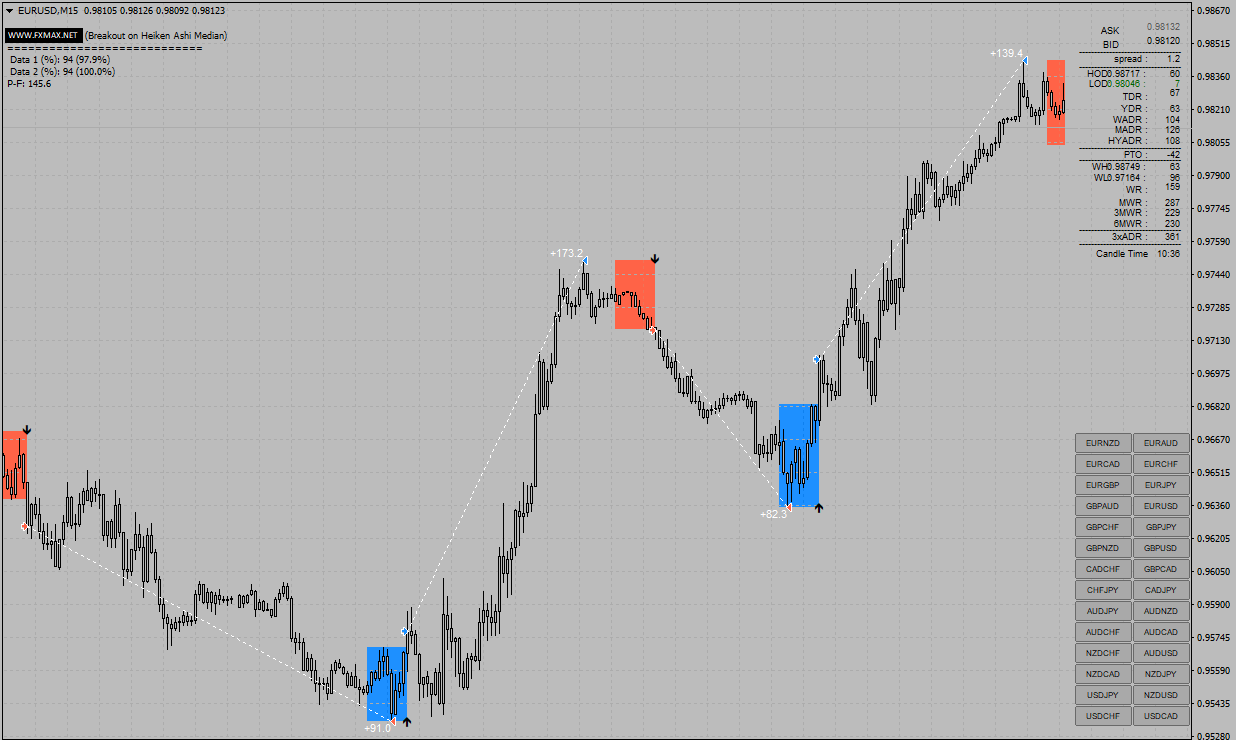
 Rapid Entry Signals – Instantly identifies optimal entry points with minimal lag, giving traders the edge in fast-moving markets.
 Multi-Timeframe (MTF) Analysis – Synchronizes signals across multiple timeframes, ensuring that short-term trades align with higher trend direction.
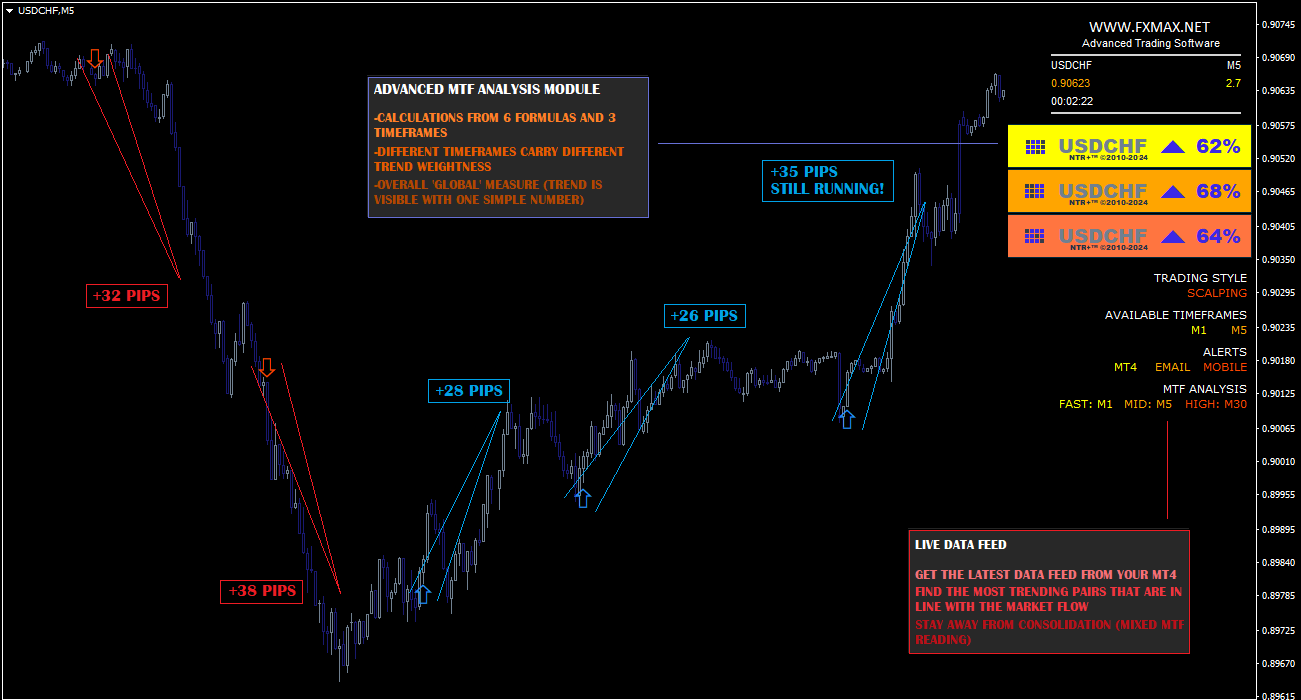
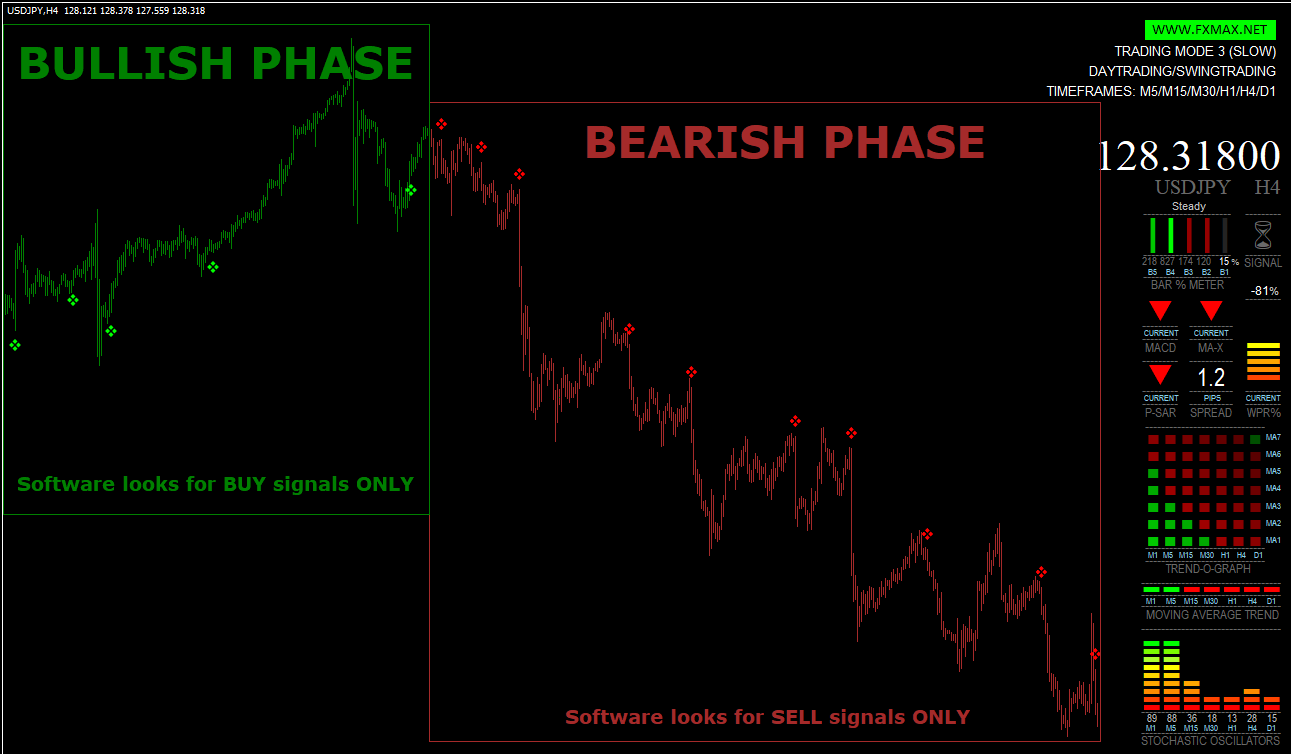
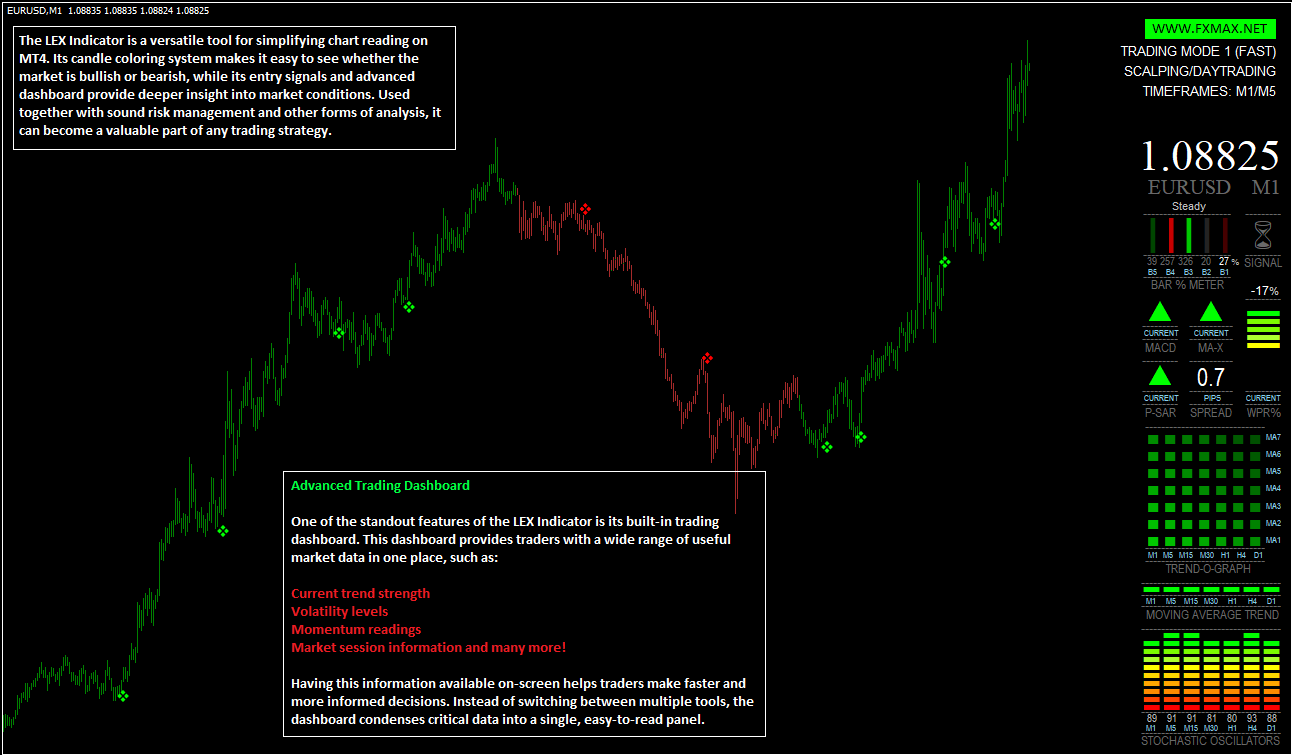
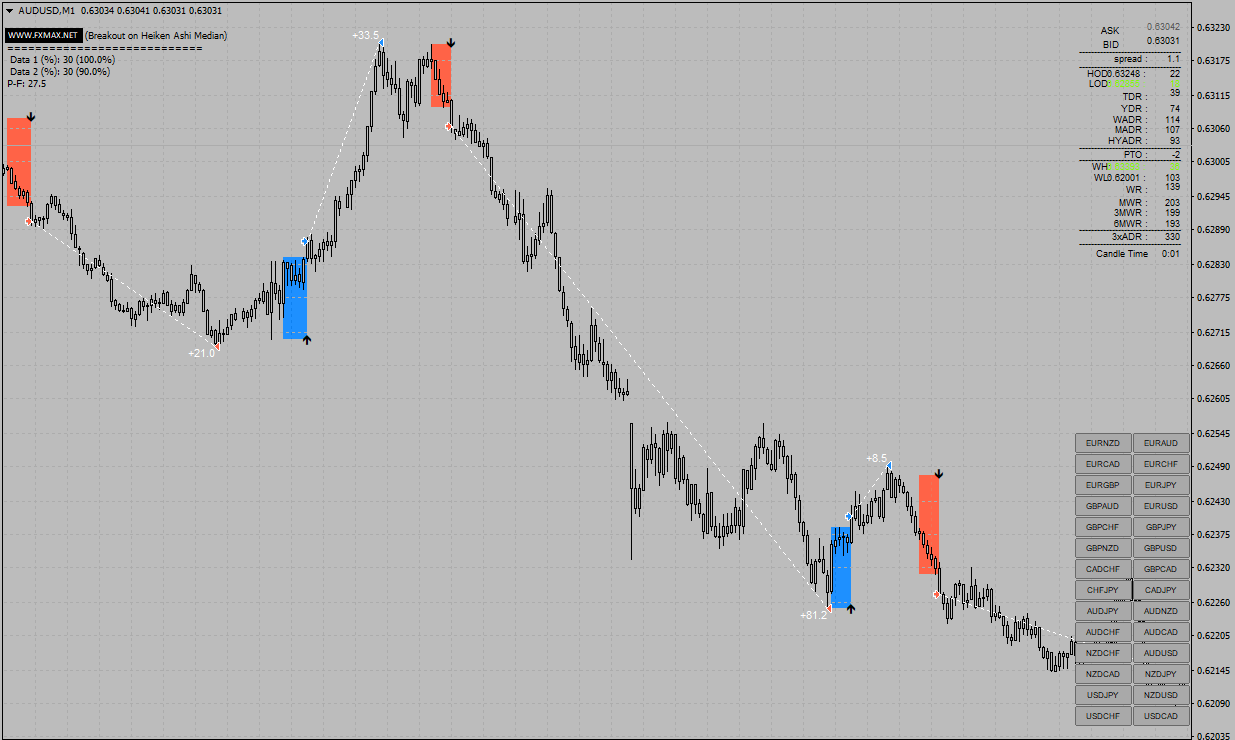
 Advanced Scalping Techniques – Perfect for traders who thrive on quick, intraday setups. The indicator highlights scalping opportunities with pinpoint precision.
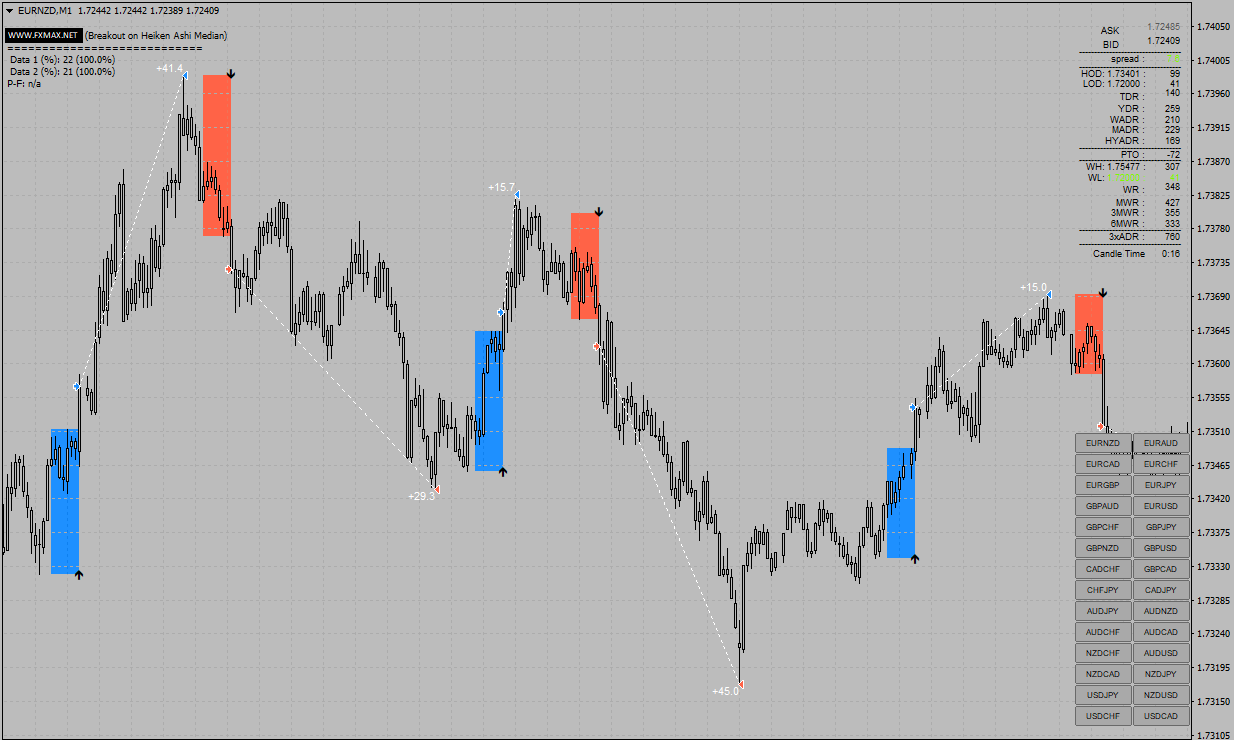
 Day Trading Optimization – Not only for scalpers, Supreme Trading PRO also adapts to day trading strategies, providing setups with clear risk/reward levels.
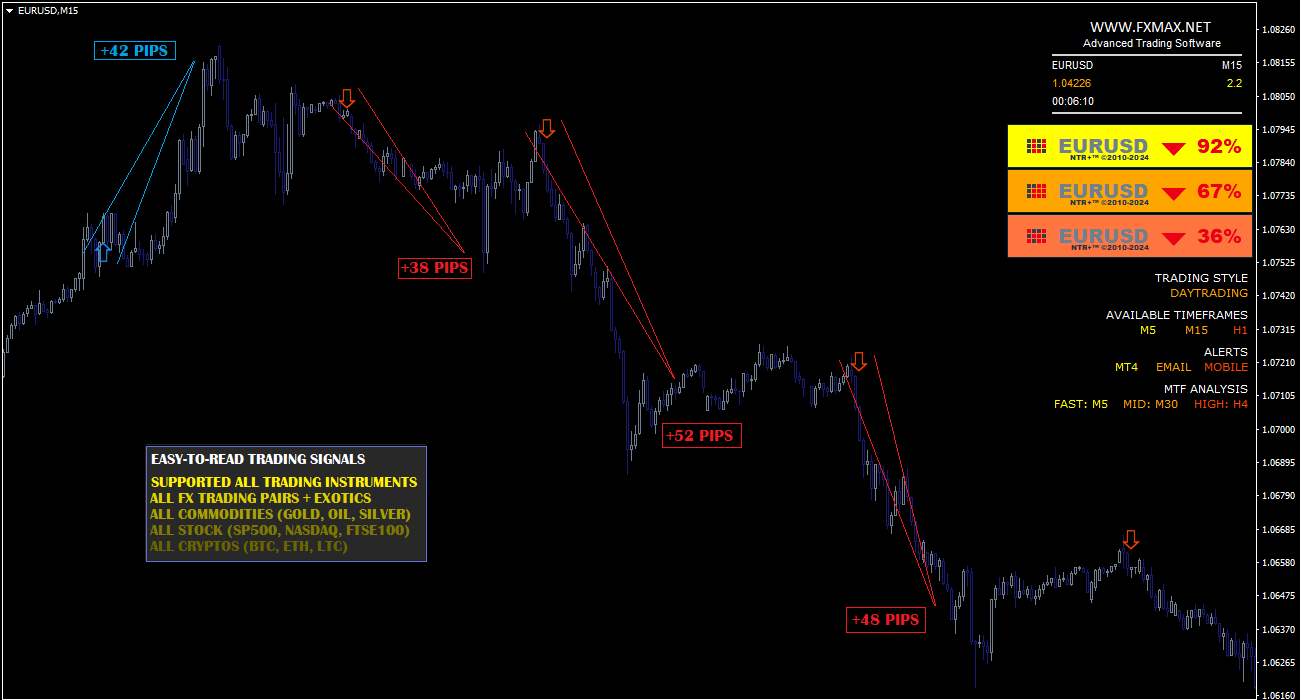
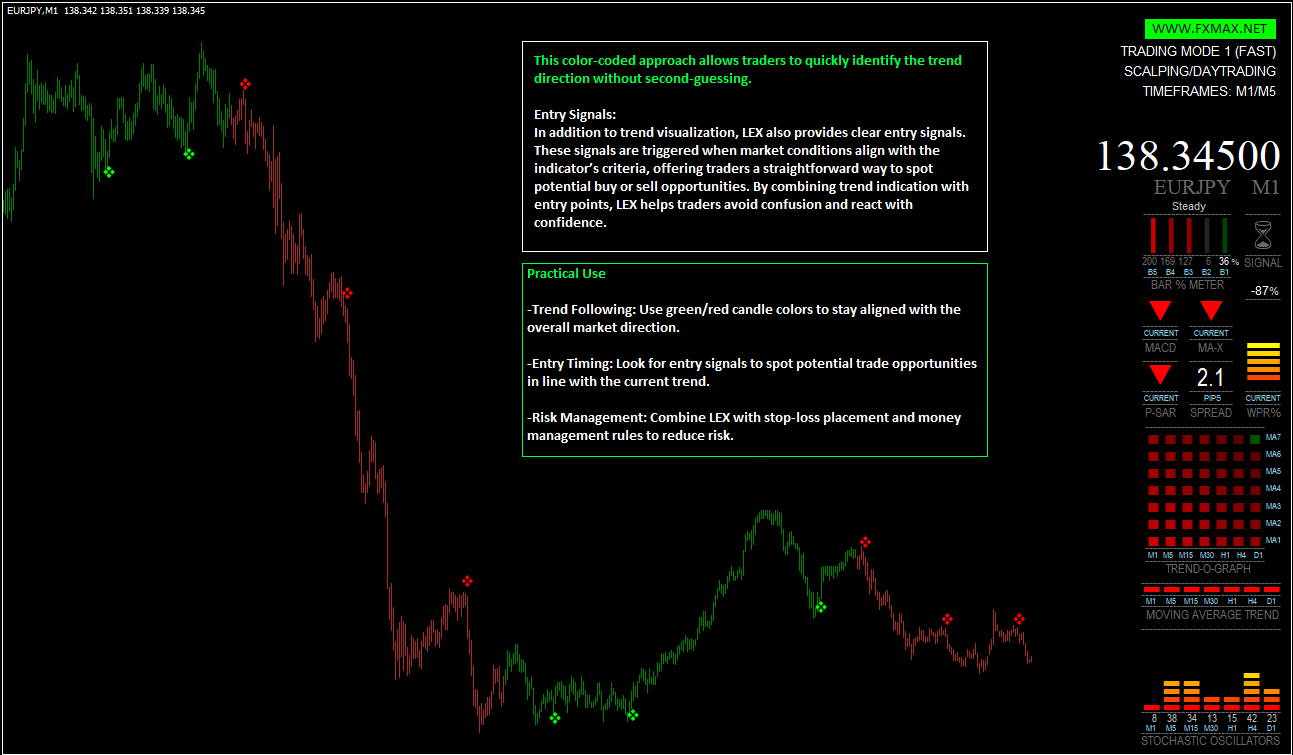
 Universal Compatibility – Works seamlessly on all instruments, including forex pairs, stock CFDs, indices, gold, oil, and even crypto assets.
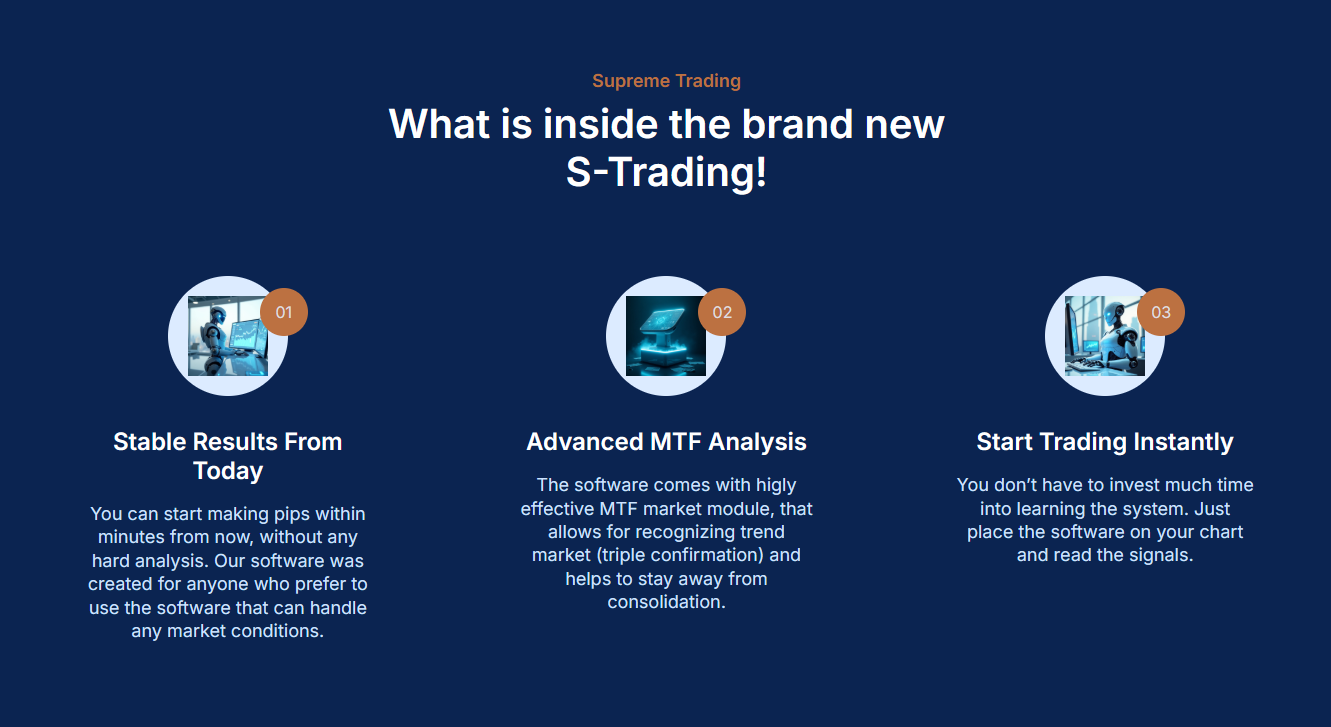
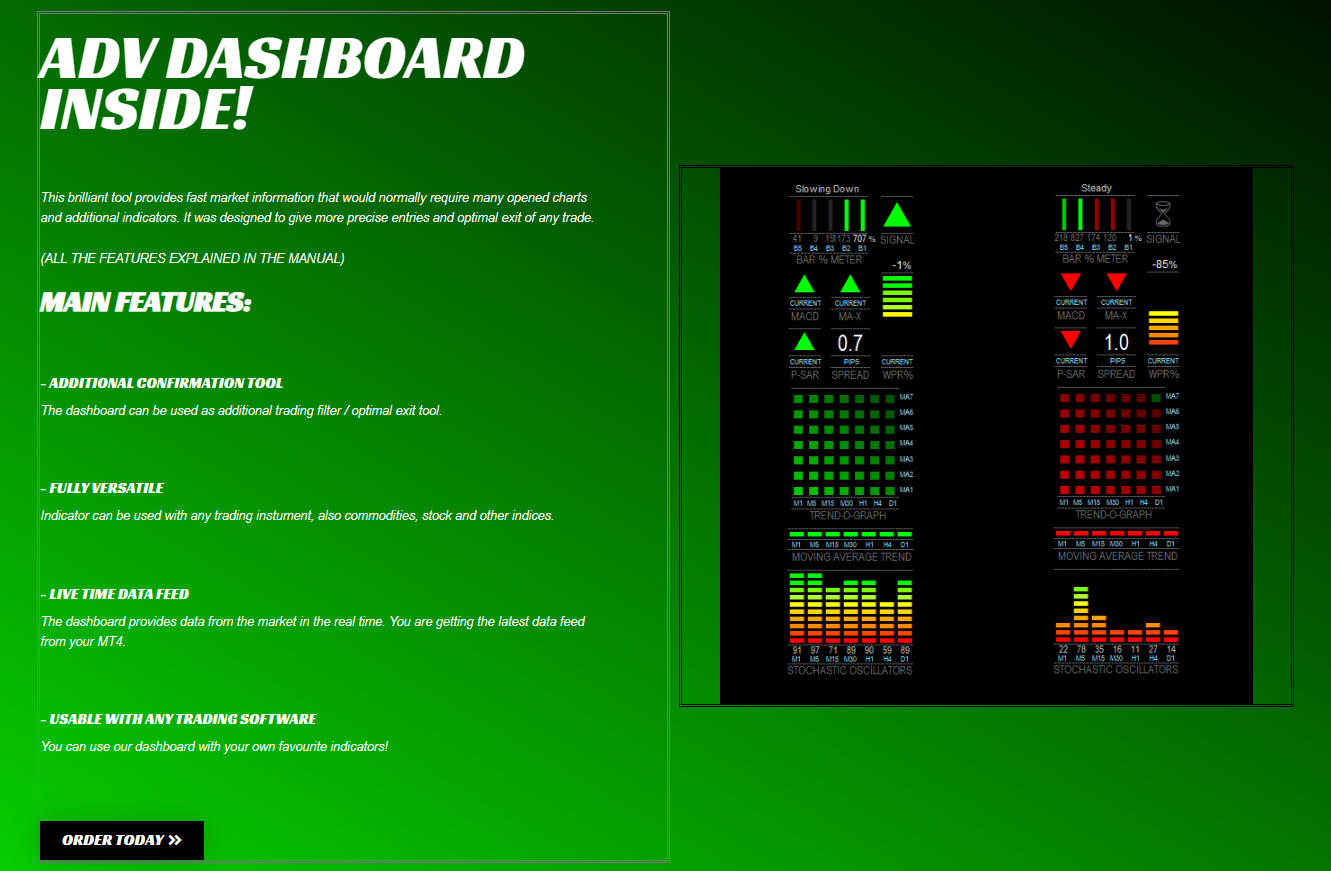
Why Choose Supreme Trading PRO?
This tool isn’t just another MT4 indicator – it’s a complete trading assistant. By combining rapid entries with powerful MTF filtering, traders can avoid false signals and focus only on high-quality opportunities. Whether you are scalping for quick profits or day trading for bigger moves, Supreme Trading PRO adapts to your style.
Advantages
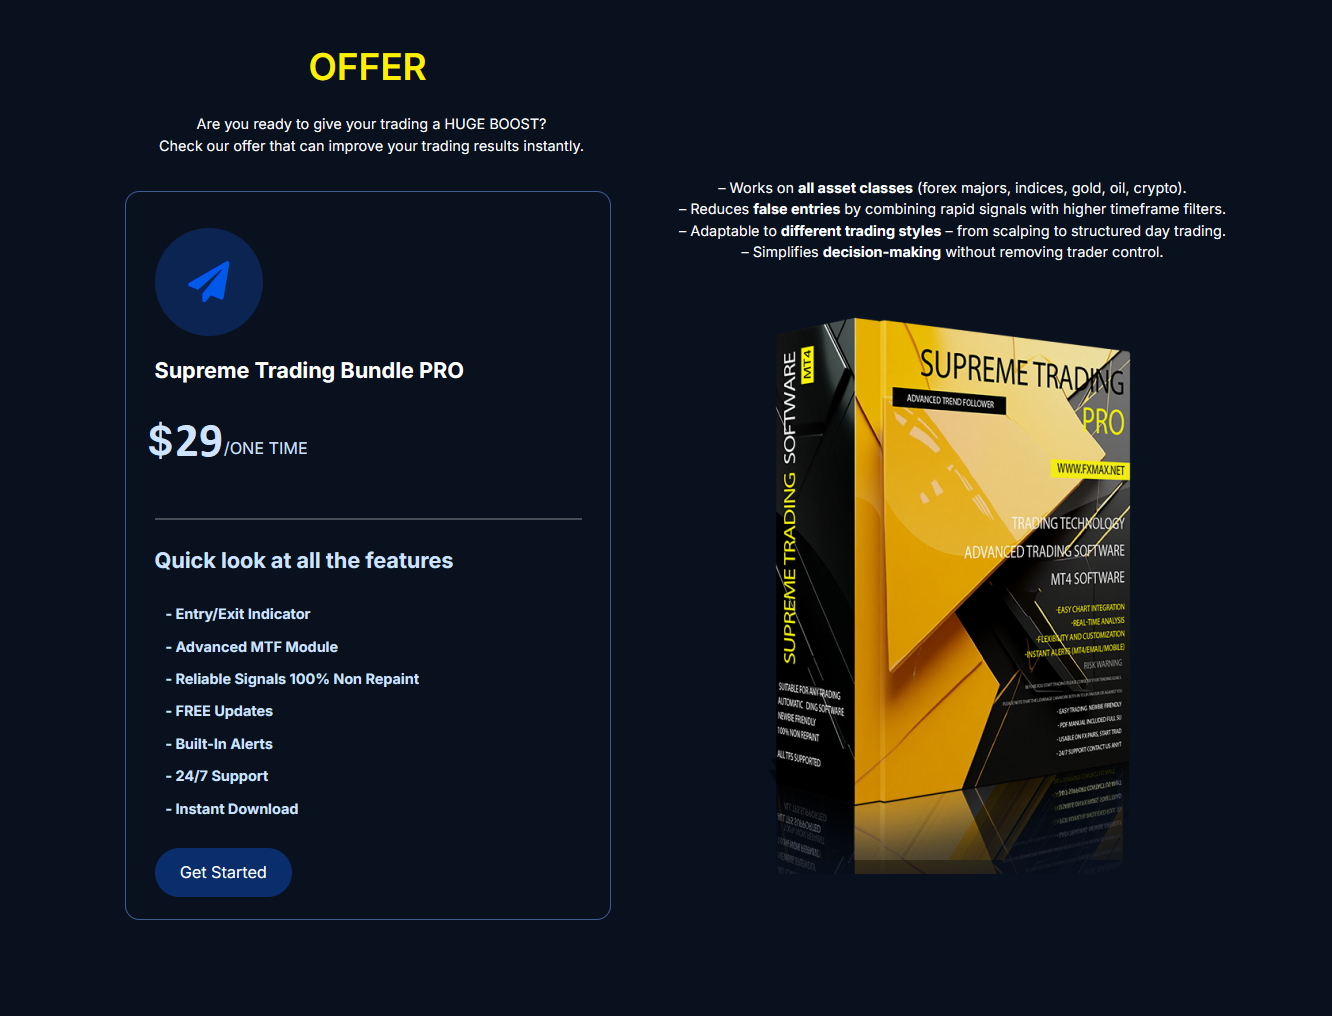
Works on all asset classes (forex majors, indices, gold, oil, crypto).
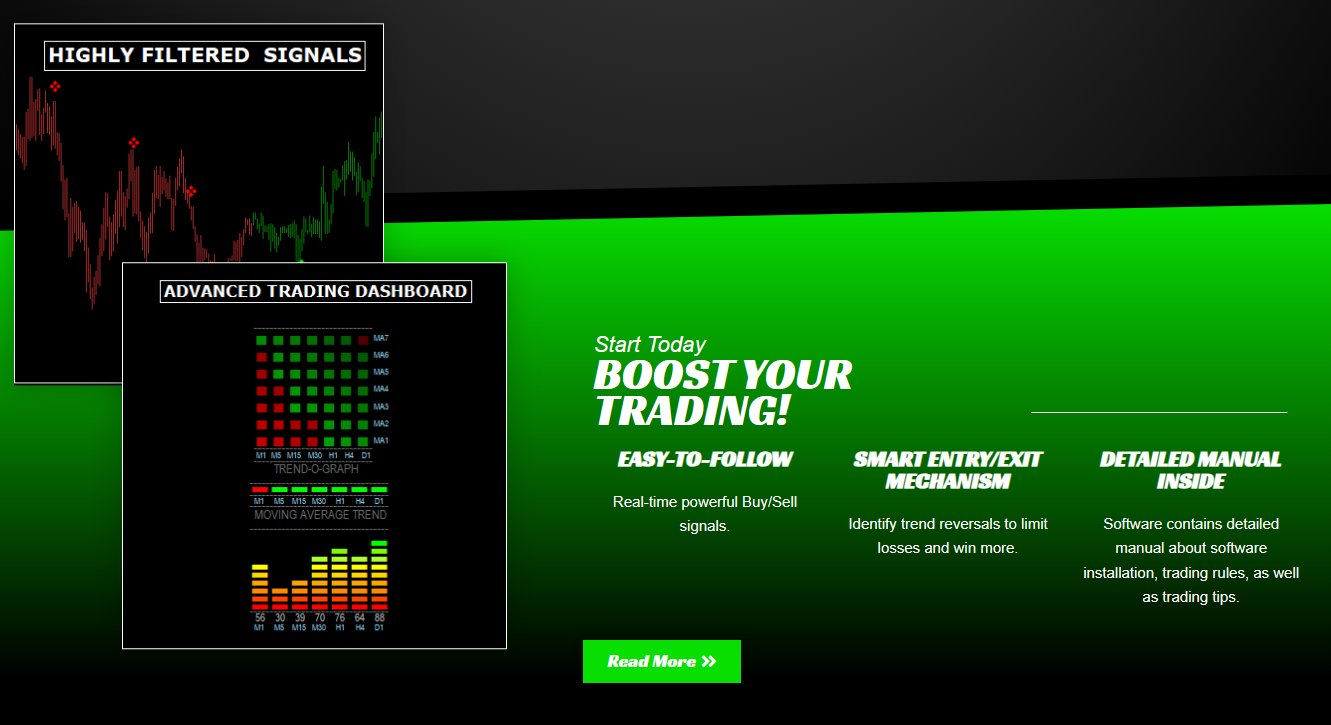
Reduces false entries by combining rapid signals with higher timeframe filters.
Adaptable to different trading styles – from scalping to structured day trading.
Simplifies decision-making without removing trader control.