


Lex Scalper – B/B Phase
- Estimated Delivery : Instant Download
- Updates Included: Yes
Understanding the LEX Indicator on MT4
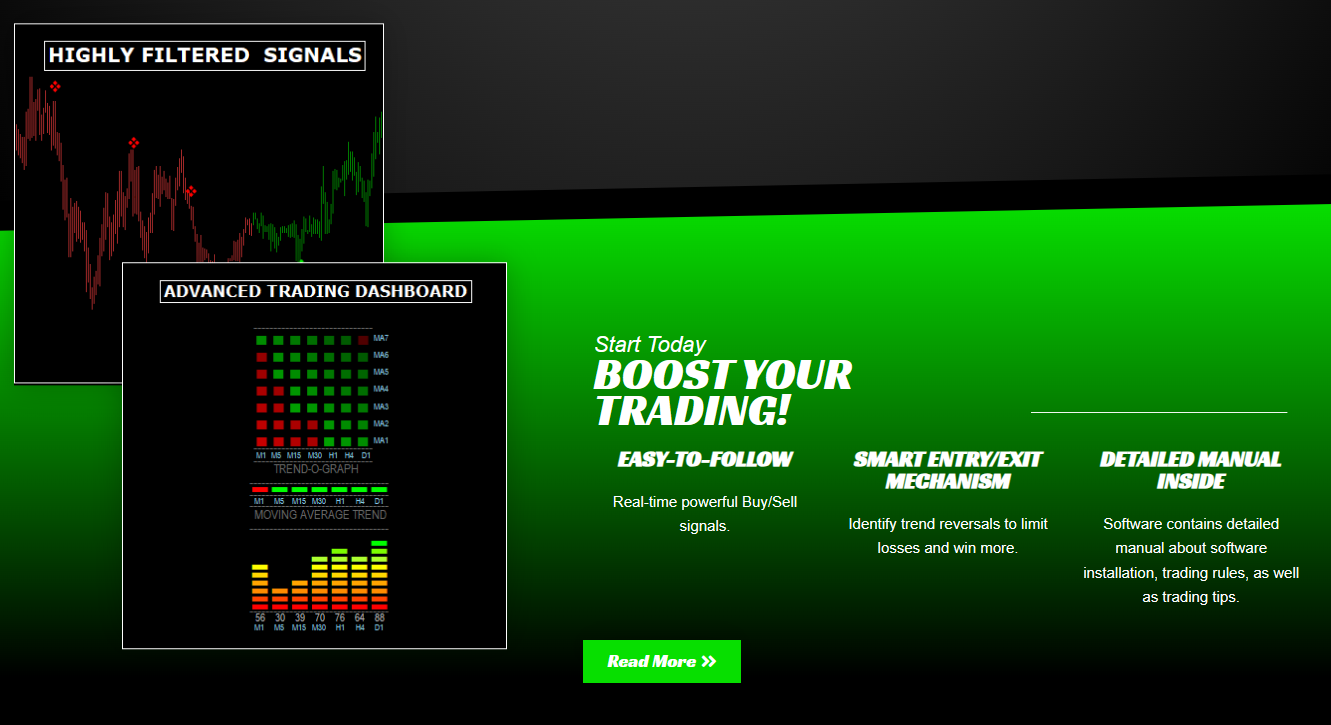
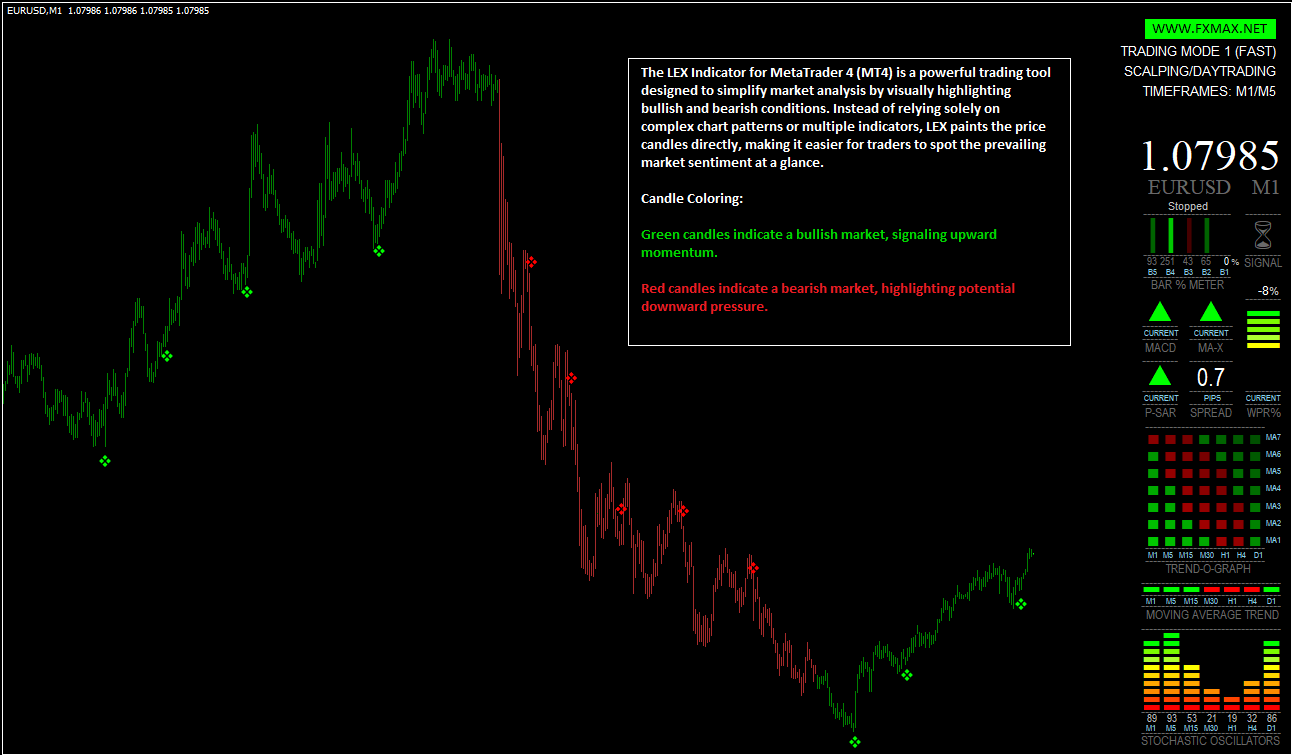
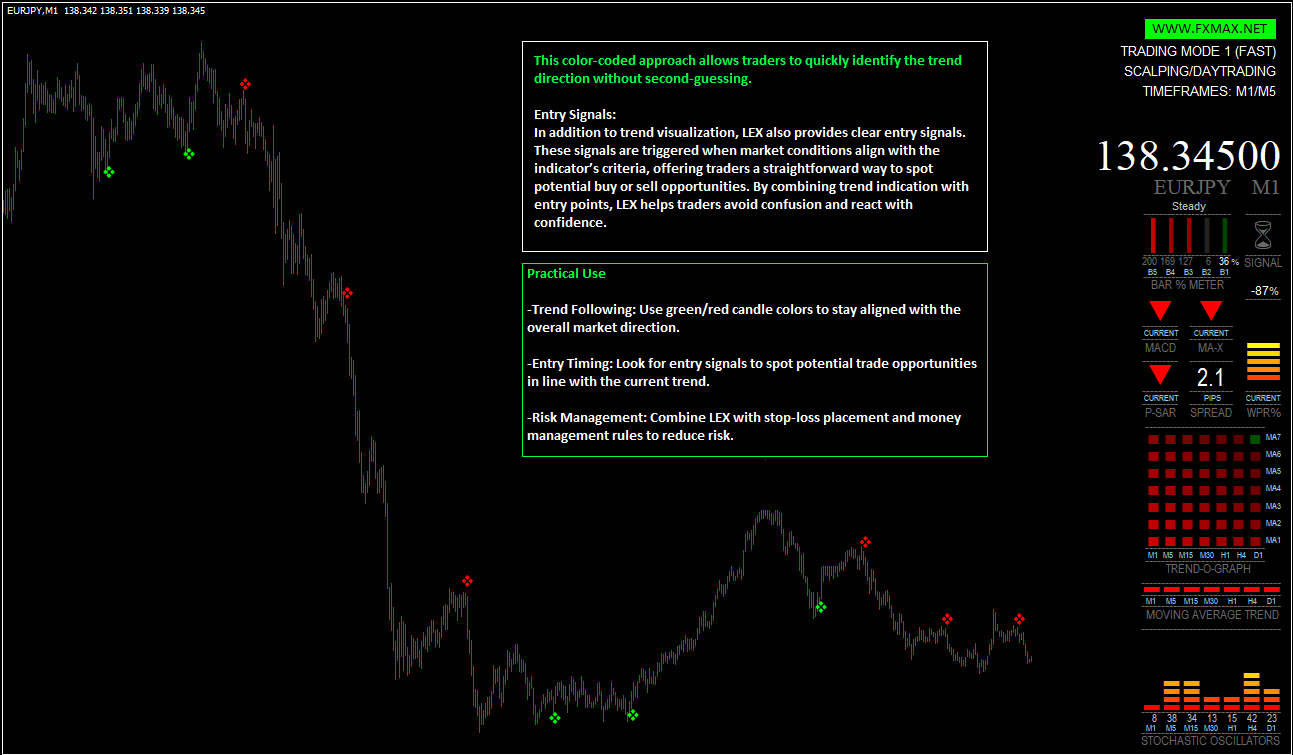
The LEX Indicator is a custom tool for MetaTrader 4 (MT4) that helps traders identify market direction and potential entry points more clearly. It does this by painting candles on the chart in different colors, depending on whether the market is showing bullish or bearish momentum.
How It Works
-
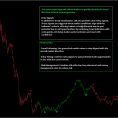
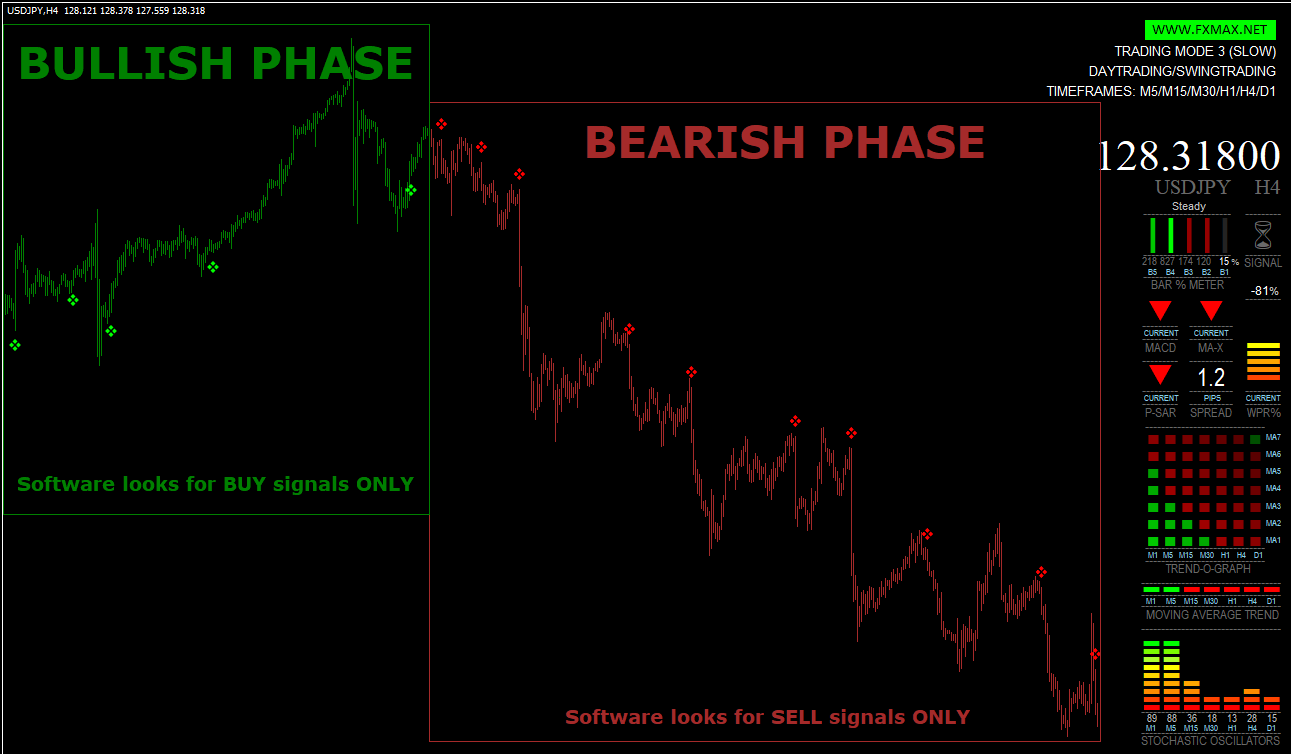
Green candles: These appear when the indicator detects bullish conditions, suggesting that buying pressure is stronger and the price may continue upward.
-
Red candles: These appear during bearish conditions, signaling stronger selling pressure and a possible continuation to the downside.
By changing candle colors, LEX gives traders a quick visual cue about the current market sentiment without needing to interpret multiple indicators.
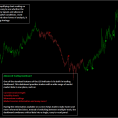
Entry Signals
Beyond coloring candles, LEX also generates entry signals. These signals are shown when specific conditions are met, such as a strong bullish reversal or a bearish continuation pattern. Traders can use these signals as guidance for potential buy or sell entries. However, like with any indicator, it is best to confirm these signals with additional analysis (support/resistance levels, trendlines, or higher-timeframe trends).
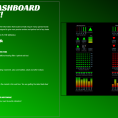
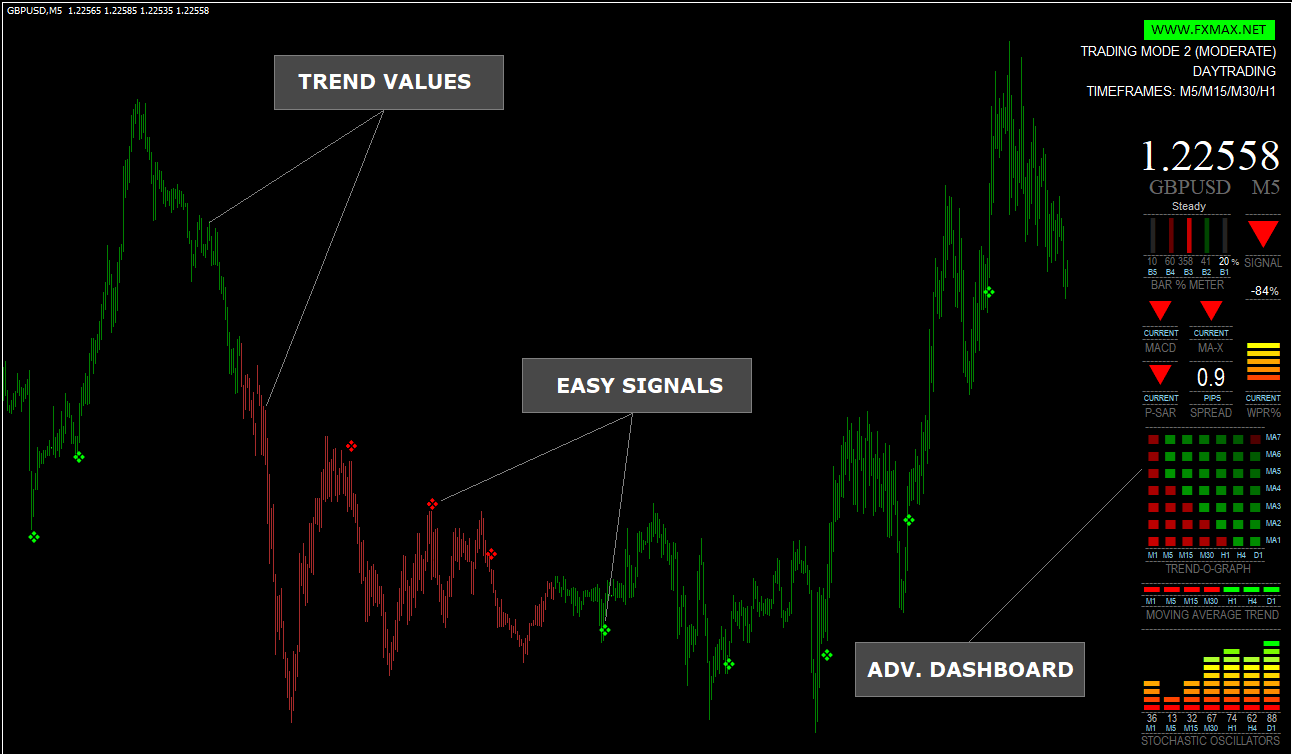
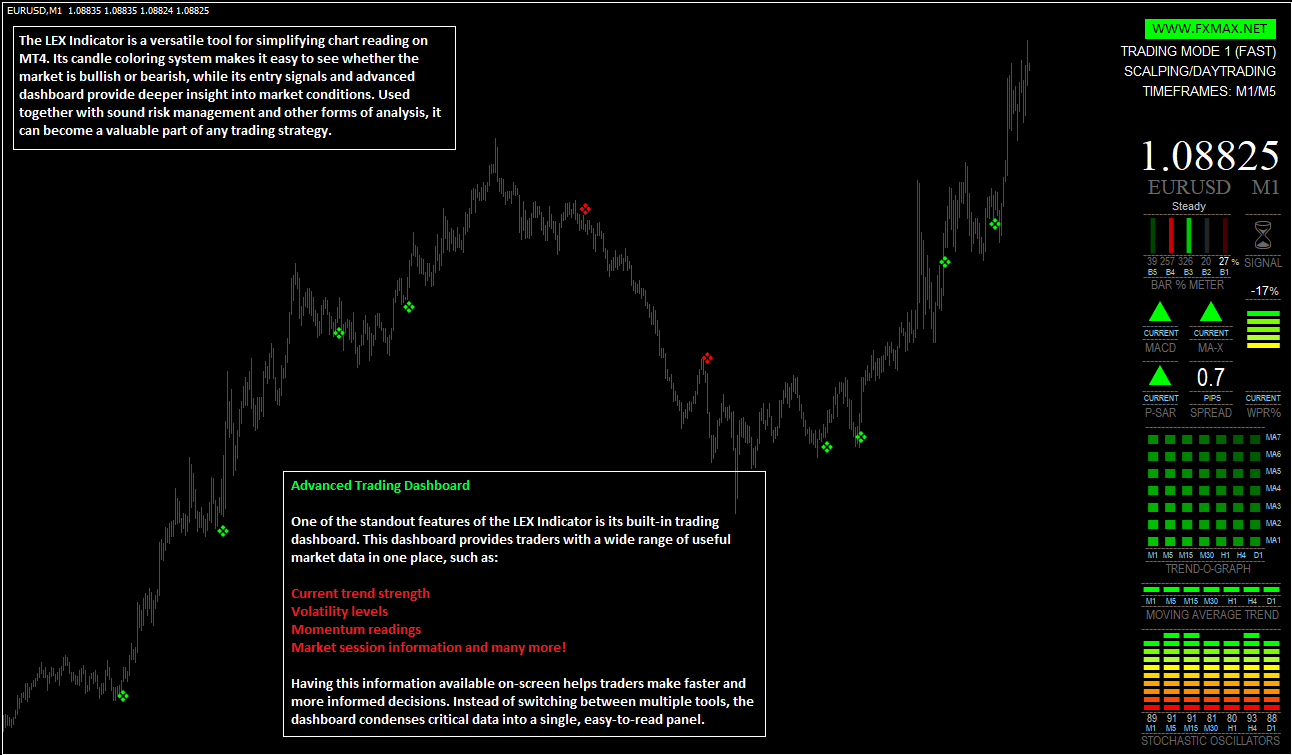
Advanced Trading Dashboard
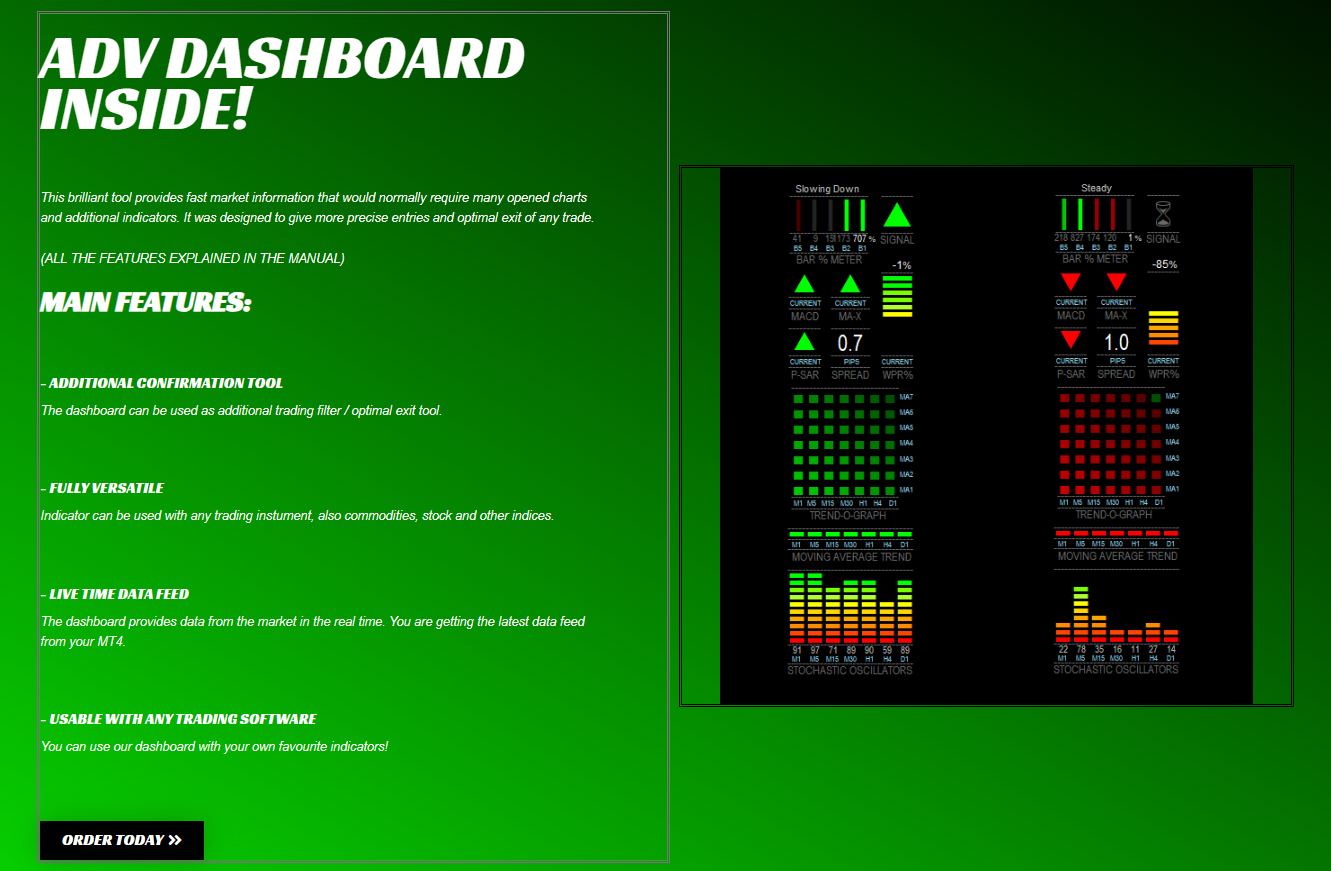
One of the standout features of the LEX Indicator is its built-in trading dashboard. This dashboard provides traders with a wide range of useful market data in one place, such as:
-
Current trend strength
-
Volatility levels
-
Momentum readings
-
Market session information and many more!
Having this information available on-screen helps traders make faster and more informed decisions. Instead of switching between multiple tools, the dashboard condenses critical data into a single, easy-to-read panel.
Practical Use
-
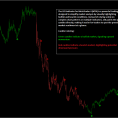
Trend Following: Use green/red candle colors to stay aligned with the overall market direction.
-
Entry Timing: Watch for entry signals to spot potential trade opportunities in line with the trend.
-
Dashboard Insights: Monitor the advanced trading dashboard to confirm the strength of a signal and understand the broader market context.
-
Risk Management: Combine LEX with stop-loss placement and money management rules to reduce risk.
LEX Dashboard features
– A graph of Stochastic Oscillators on timeframes M1 up to D1.
– An indication of the market trend using Moving Averages on timeframes M1 to D1.
– The direction of the MACD on the current chart, and crossing of the signal line and zero line.
– The direction of a fast 3 period LWMA crossing a 5 period SMA (periods customizable).
– The direction of the Parabolic SAR on the current chart for giving the exit signal and also confirmation for entry.
– An oscillating graph of the William’s % Range indicator. This was used because of its fast movement and unique predictive quality. Also because its very good for identifying Overbought/Oversold conditions.
– A Bar % Increase/Decrease meter developed to give a direct visual representation of the percentage rise or fall of the current price compared to the last 4 bars. It’s simple but effective. The gist of it is that the previous 4 bar movements (close to close) are averaged and percentaged, so if the current bar rises above 100% it is speeding up above the recent average, conversely if it drops below 100% it is slowing down and taking on a more steady movement. Strong price movements are displayed in bright red or green, with varying shades according to the strength of movement.
– The overall recommended signal to trade, based on the various indicator signals.
– And last but not least the spread of the currency, in big easy-to-see numbers.
– A History viewer in the form of a vertical line that can be dragged over previous bars to bring up the history.
– A multi-timeframe Trend Graph showing the direction of 7 customizable Moving Averages on 7 timeframes.
– An OB/OS Signal Map, showing the Overbought or Oversold signals from 7 different oscillators/indicators on 7 timeframes.
– Customizable Overall Signal, using a combination of current and multi-timeframe indicator signals.
– Price/Chart/Currency display that can be switched on or off.
– Switch between Default and Compact mode.
Conclusion
The LEX Indicator is a versatile tool for simplifying chart reading on MT4. Its candle coloring system makes it easy to see whether the market is bullish or bearish, while its entry signals and advanced dashboard provide deeper insight into market conditions. Used together with sound risk management and other forms of analysis, it can become a valuable part of any trading strategy.


 Market Structure - Smart Money Concepts
mateo –
a bit complicated
software comes with detailed manual, but honestly I'm onlyw atching if this is green or red and then confirm the trade :))
Mo85 –
Fast deliver, thx!
Fast deliver, thx!
Gavin –
Simply Brilliant
Wow, bought it at discount and pretty shocked. Using simple, no brain mode (green buy, red sell) and it filters like a charm. I need to get into advanced settings, maybe this can boost the results even more.