

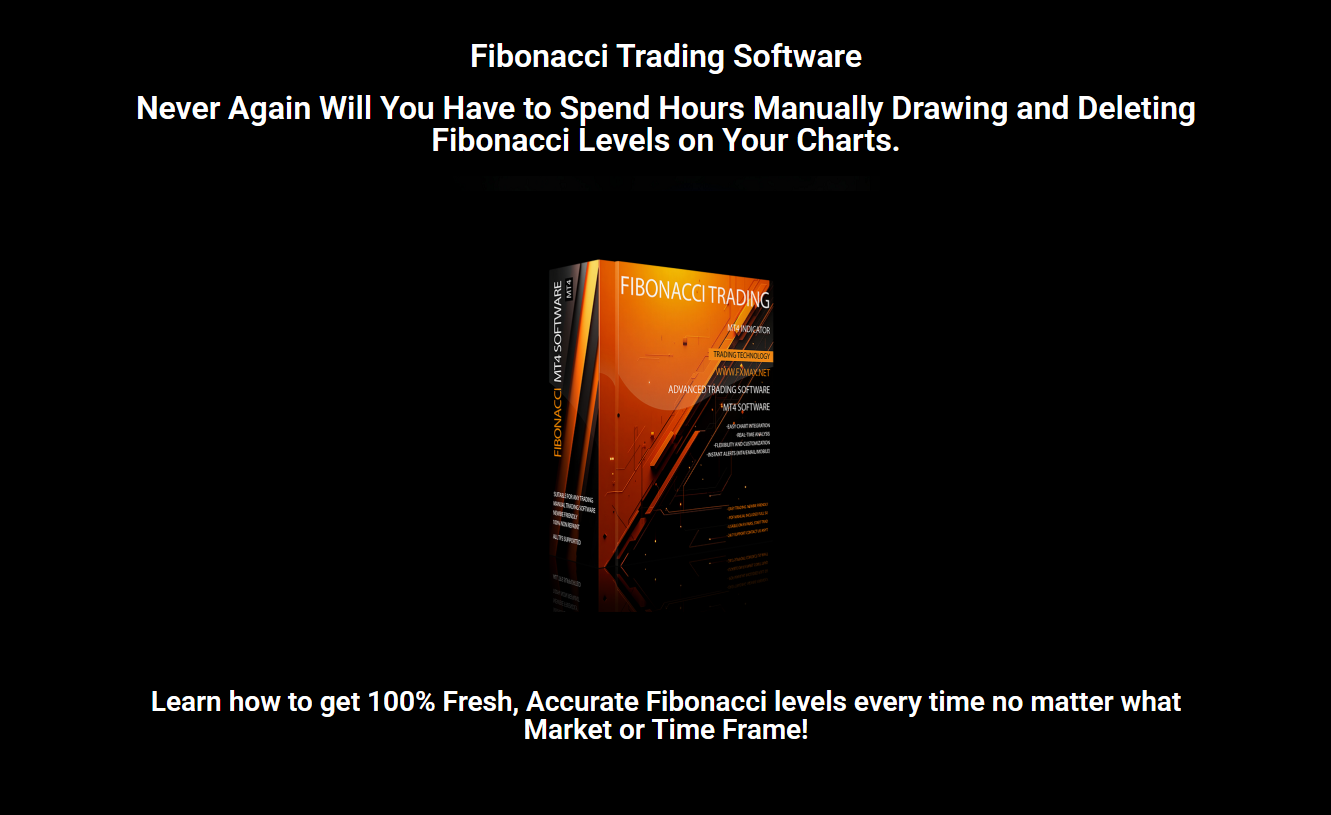
Fibonacci Advanced Trading Software
- Estimated Delivery : Instant Download
- Updates Included: Yes
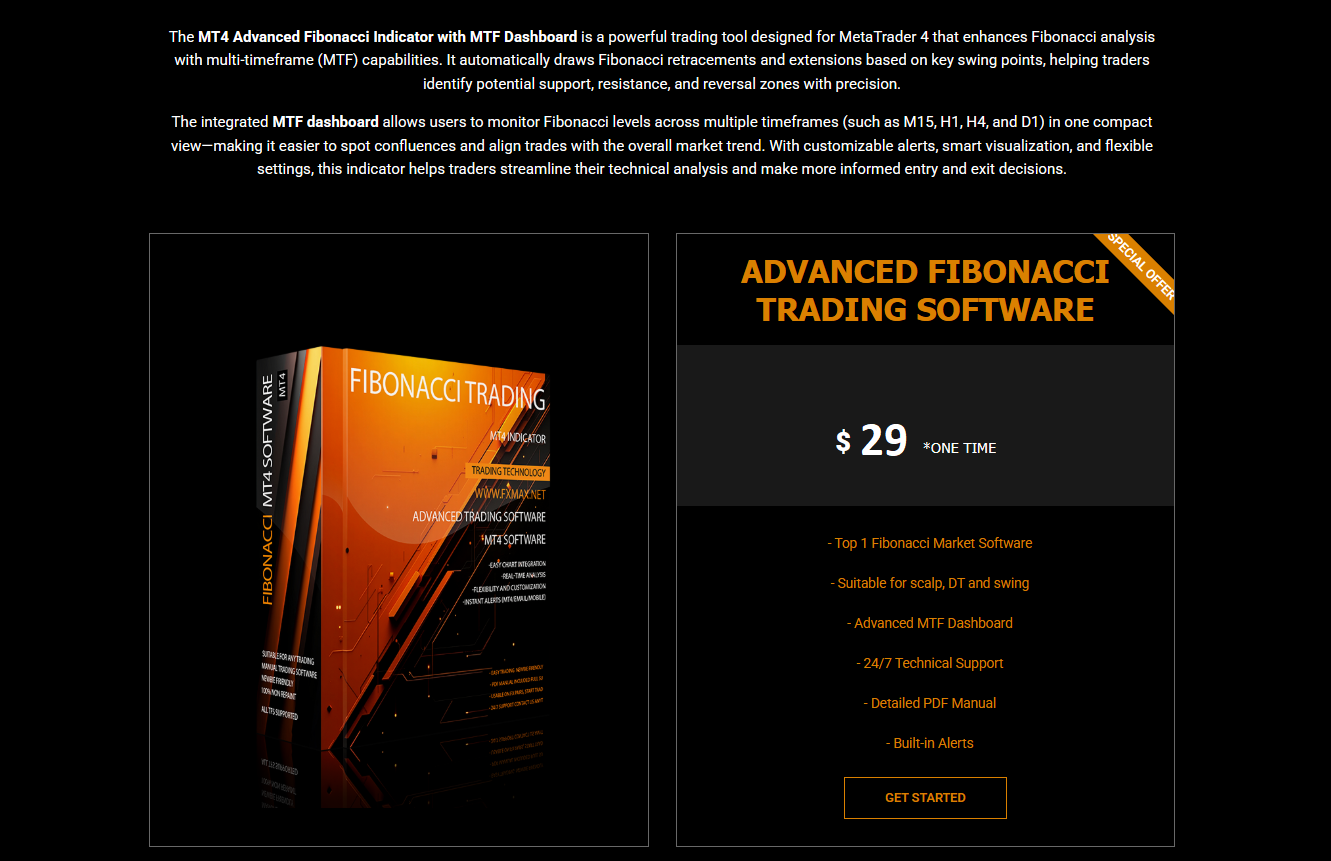
MT4 Advanced Fibonacci Indicator with MTF Dashboard
MT4 Advanced Fibonacci Indicator with a Multi-Timeframe (MTF) Dashboard that automatically plots Fibonacci levels and provides alerts.
Overview
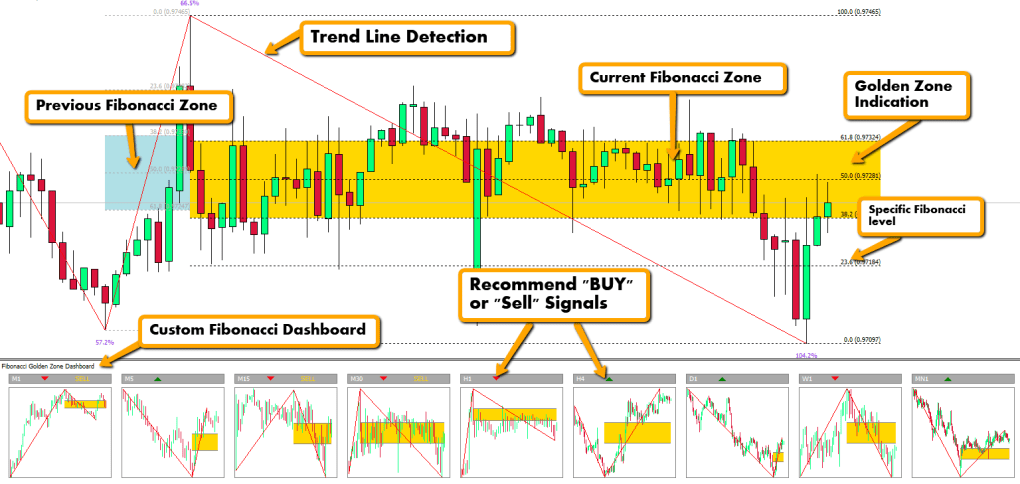
The MT4 Advanced Fibonacci Indicator (MTF Dashboard) is a professional MetaTrader 4 indicator that automatically identifies swing highs/lows, draws Fibonacci retracement and extension levels across multiple timeframes, and displays a compact dashboard summarizing the status per timeframe and symbol. The indicator supports configurable alerts (popup, sound, email, push) when price approaches important levels, when new swings form, or when a level is broken — giving you timely, actionable notifications without constantly watching the screen.
Key Features
-
Automatic Fibonacci plotting: Detects swing high/low points and draws retracement and extension levels automatically.
-
Multi-Timeframe (MTF) Dashboard: Shows the Fibonacci structure and level proximity for several user-selected timeframes (e.g., M15, H1, H4, D1) in one compact panel.
-
Alerts: Popup, sound, email and push notifications for events such as: price touching a Fibonacci level, multiple timeframe confluence, level breakouts, and new swing creation.
-
Customizable levels: Choose which Fibonacci levels to display (e.g., 23.6, 38.2, 50.0, 61.8, 78.6, 100, 161.8, 261.8).
-
Level proximity filter: Trigger alerts only if price is within a configurable number of pips or percentage of a level.
-
Confluence & signal scoring: Score or highlight levels that align across timeframes or with other filters (MA trend, pivot, RSI support/resistance).
-
Non-repainting swing detection: Uses confirmed swing logic (e.g., number of bars after pivot) to avoid false repainting where possible.
-
Persistent object naming: Each Fibonacci drawing has a consistent name so you can programmatically reference or remove it.
-
Visual customization: Colors, line widths, label formats, box transparency, and dashboard position are all configurable.
-
Performance optimized: Draws only necessary objects and minimizes CPU usage to be MT4-friendly.
-
Symbol & timeframe scanning: Dashboard can be configured to monitor the current symbol or multiple symbols via a symbol list.
How it Works (brief)
-
Swing detection: The indicator scans recent price action and identifies swing highs and lows using a configurable ‘lookback’ (pivot bars left/right) to ensure reliable pivots.
-
Fibonacci drawing: For each confirmed swing, it automatically draws retracement and extension levels from the swing low to swing high (or vice versa).
-
MTF aggregation: The dashboard requests Fibonacci data from higher/lower timeframes and displays a consolidated view — showing the nearest level, distance to price, and confluence across timeframes.
-
Alerts engine: Continuously monitors price vs levels and triggers alerts based on user rules (distance threshold, confluence count, breakout detection).
Why is it critical for your trading success that the Fibonacci Lines are placed perfectly 100% of the time…
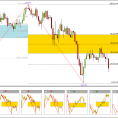
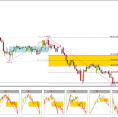
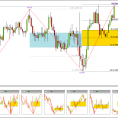
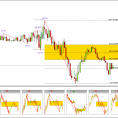
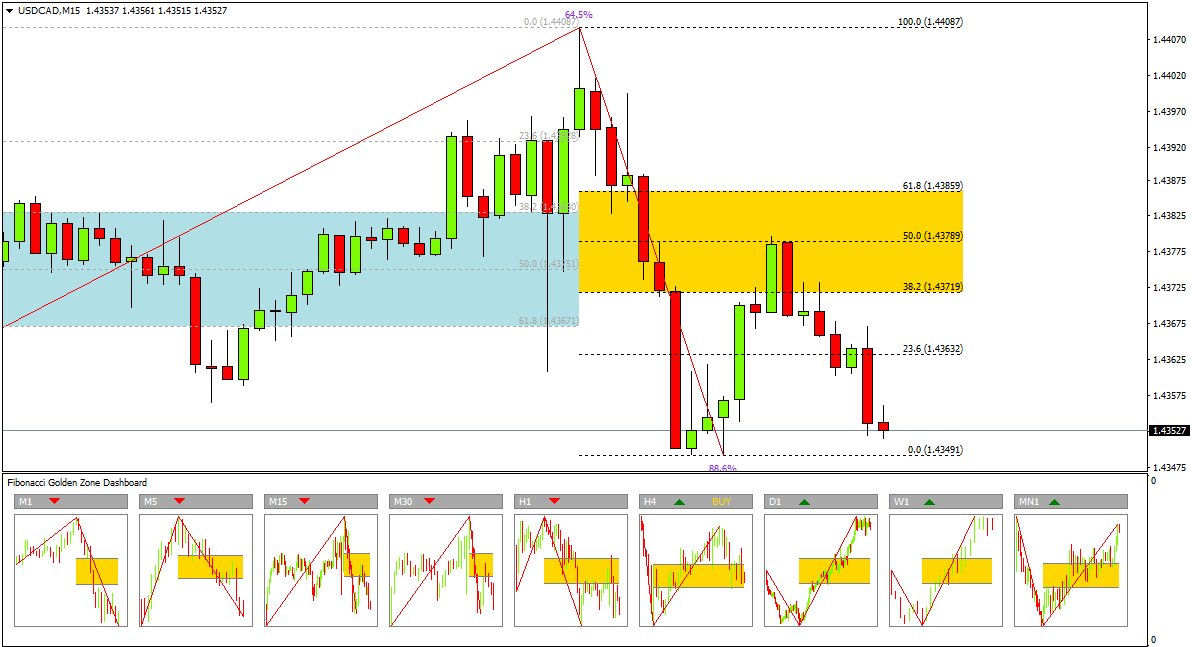
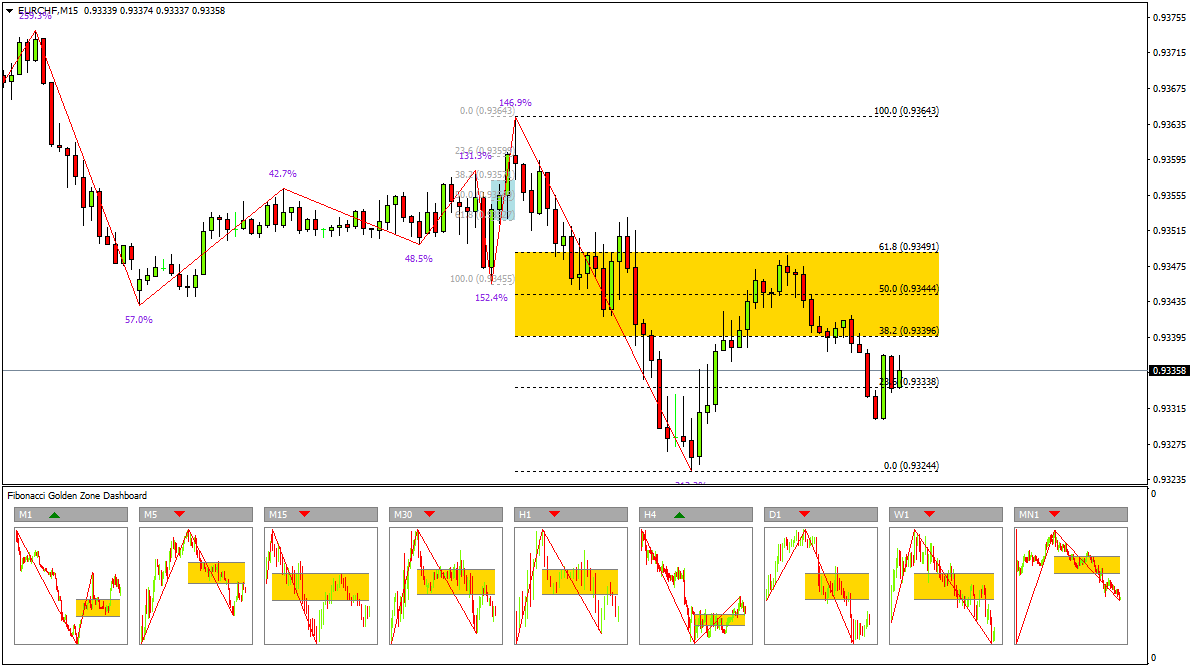
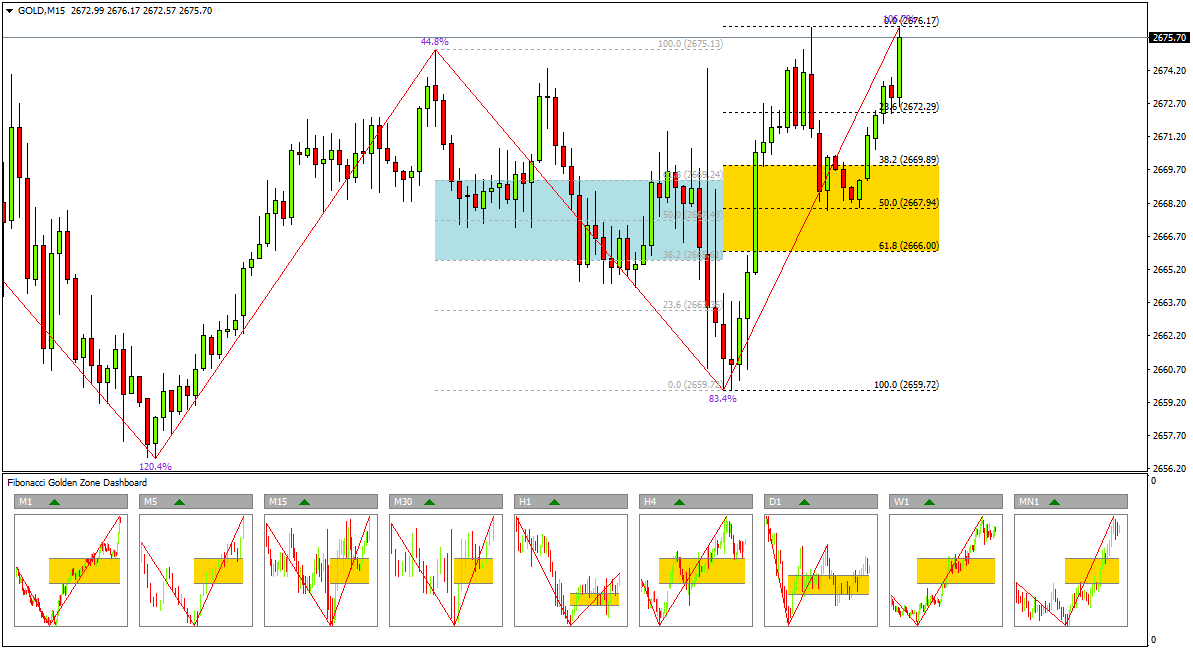
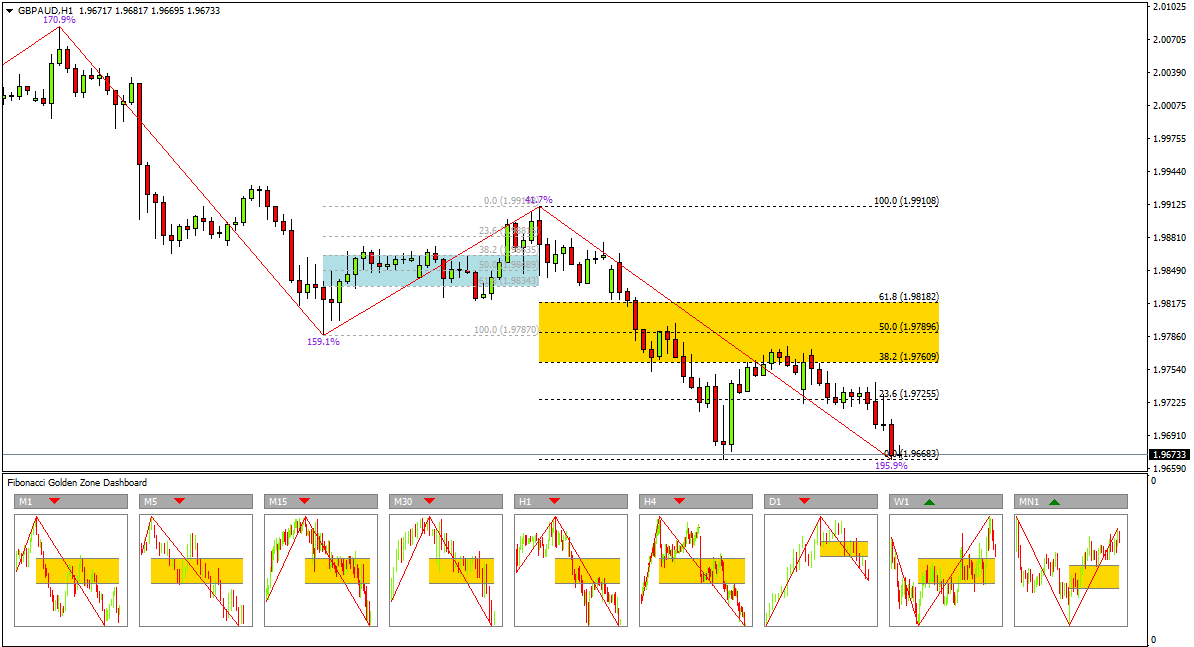
Well… We recently did a short survey and found that 68% of traders do not know how the Fibonacci sequence works and where to place the Fibonacci levels. So even if they wanted to use this powerful tool, they cannot because they did not have the knowledge and understanding to do so. Let’s take a look at the advantage of Automated Fibonacci lines Compared to Manual placing Fibonacci Lines:
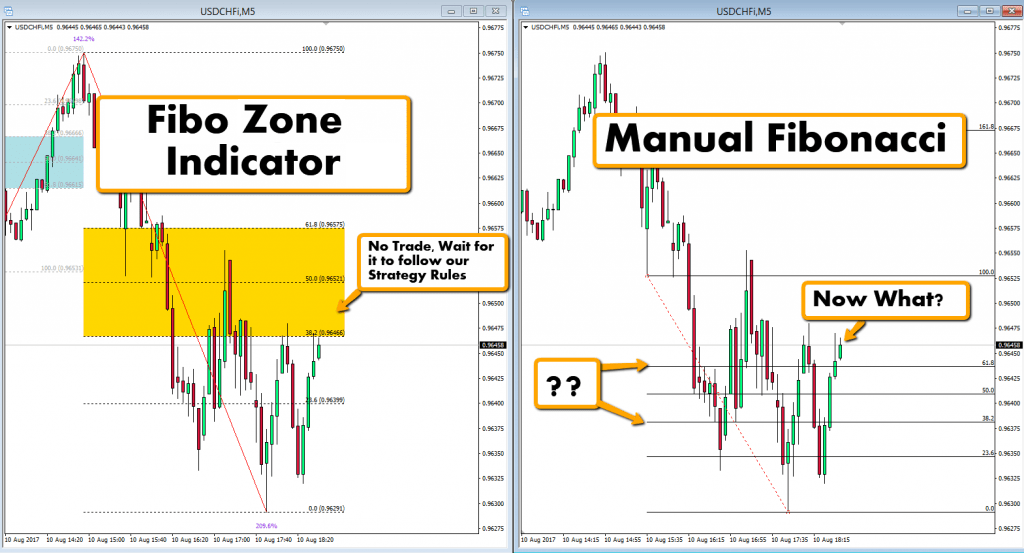
In the above example, there has not been a signal yet to sell with the Fibonacci Zone Indicator. With manually putting on the Fibonacci Lines, there was no signal and no way of knowing when to trade this.
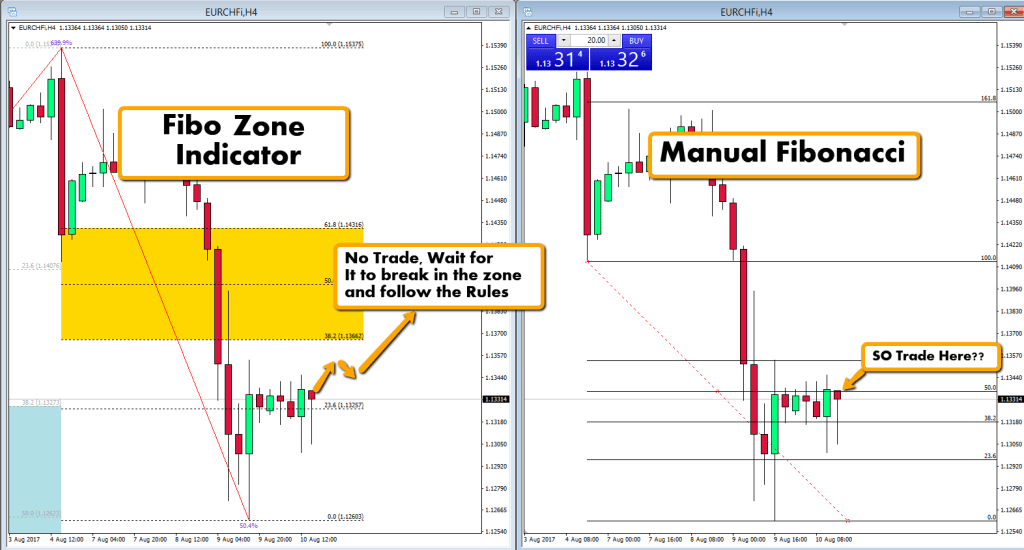
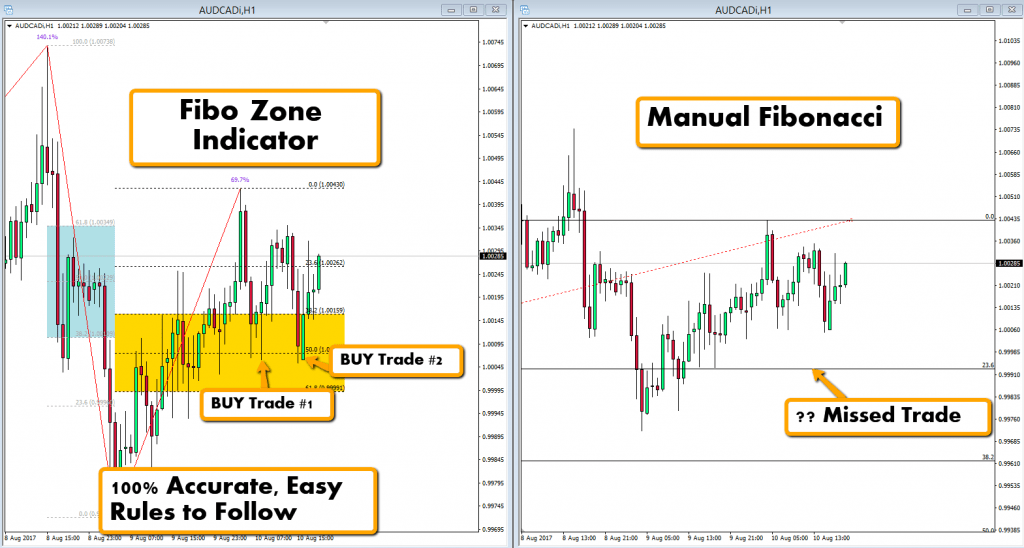
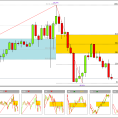
You see in these four examples how much easier and less work it is to find pullback trades with the Fibonacci Zone Indicator. Plus we have the easy-to-follow step by step rule set that you learn in our Fibonacci Zone Strategy.
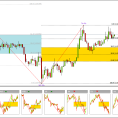
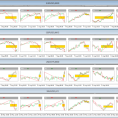
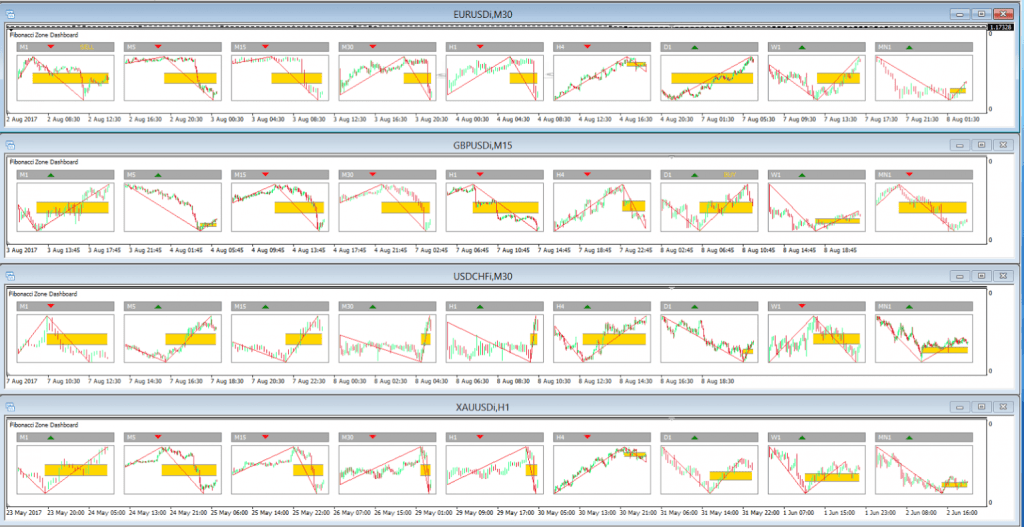
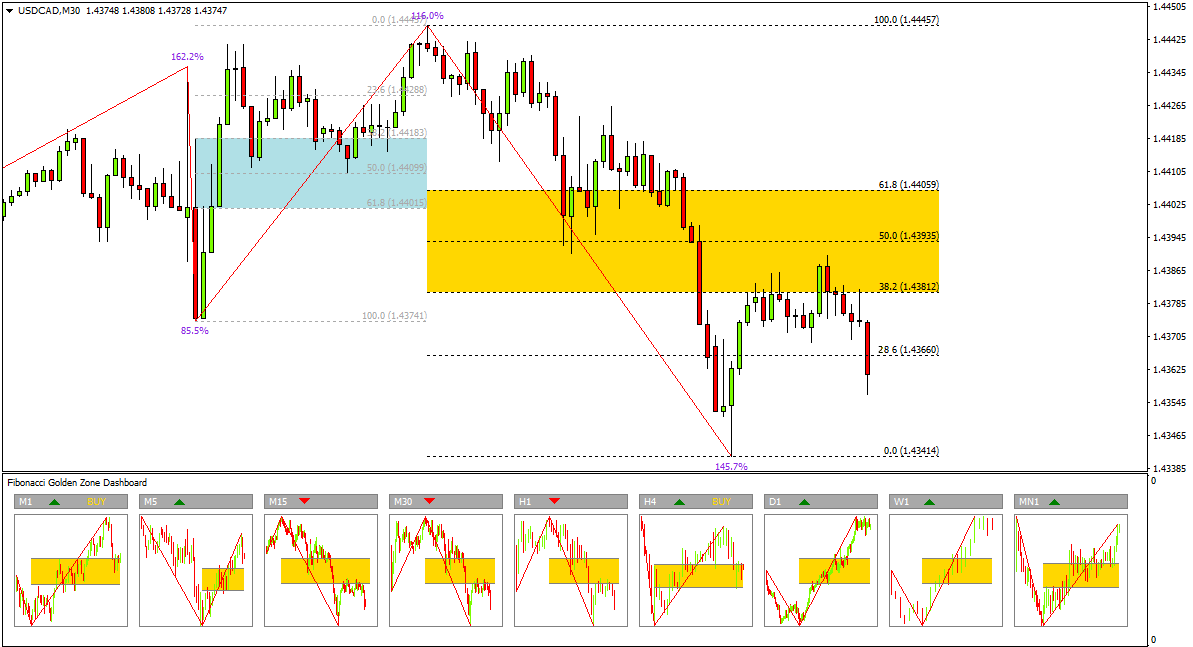
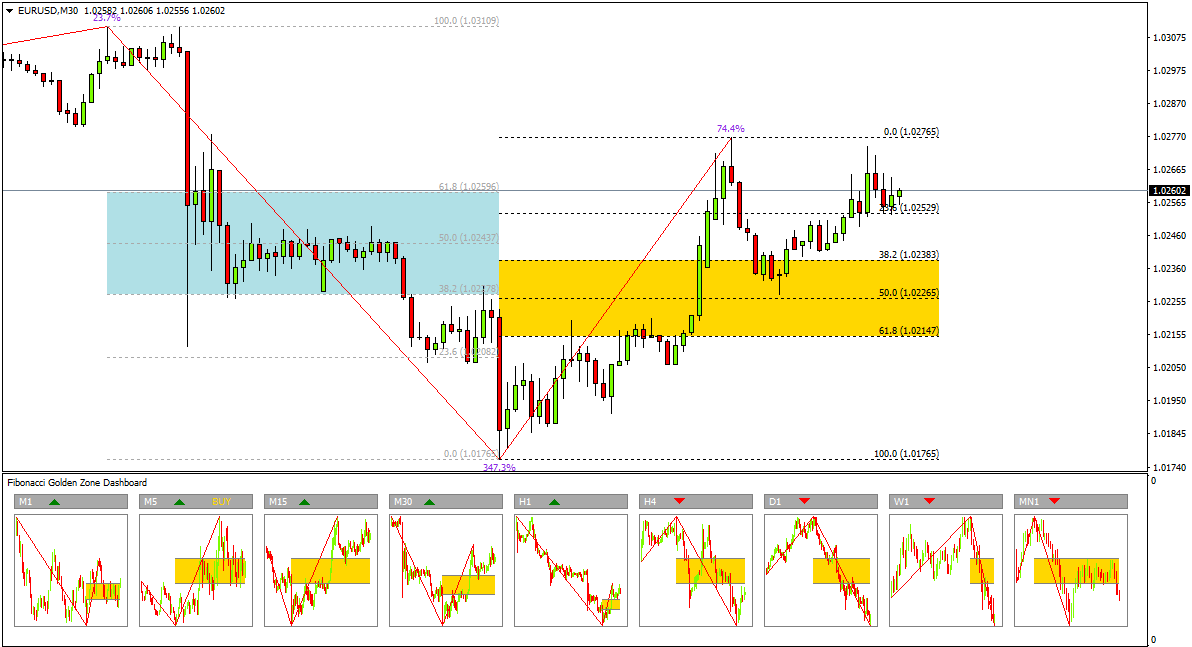
The Dashboard Scans Every Time Frame On Your Chart
The Fibonacci Dashboard is equipped with specific charting images on each time frame all the way from the minute chart all the way up to a daily chart. This is fully customizable and give you, the trader, the ability to pull whatever market and whatever time frame you wish to trade.
Fibonacci Zone Indicator


 H-Scalper PRO - MT4 Semi Expert Advisor
  TRIX Scalper - Momentum Scalping
Reviews
There are no reviews yet.